May-2026
Sales
Trend
6-Month
Product Count
SKUs
Avg Price
YoY Sales Change
YoY Price Change
Market Insights Snapshot
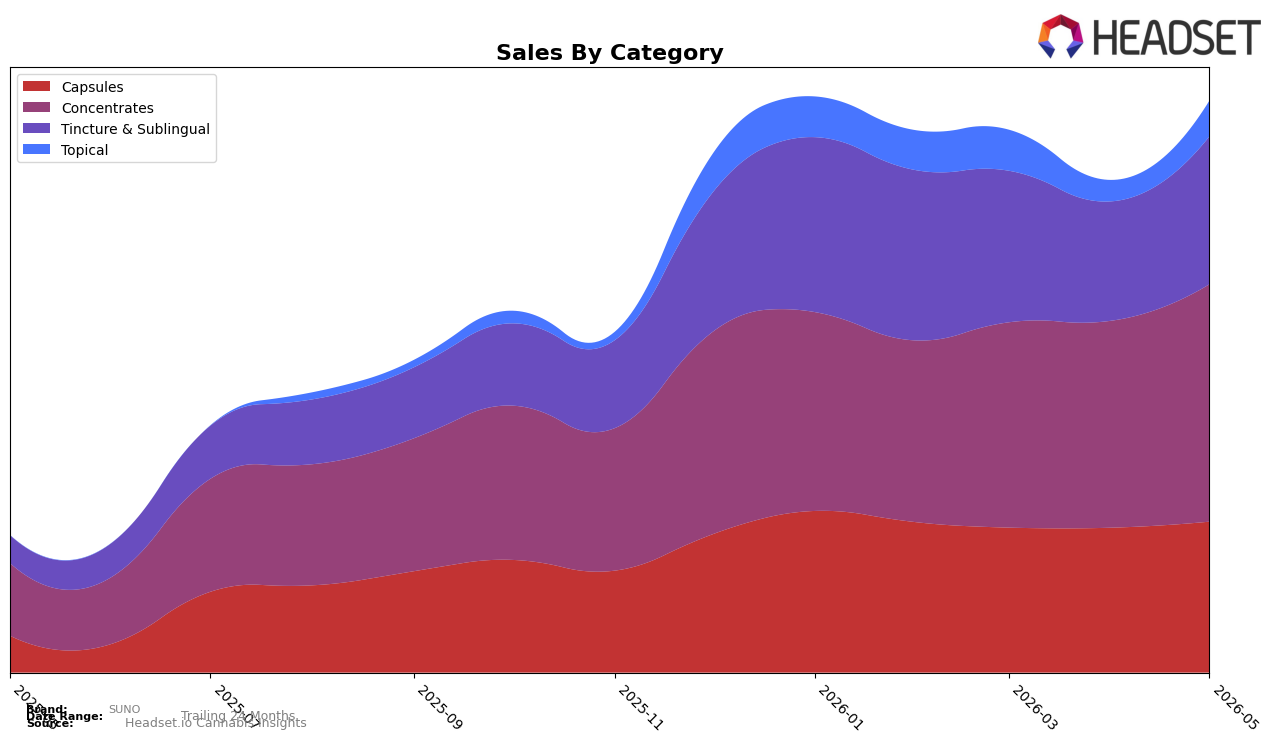
In May 2026, SUNO’s mix was concentrated in four categories: Concentrates at 41.52% share with 227.65% YoY and 14.74% MoM growth, Capsules at 26.39% share with 311.60% YoY and 4.18% MoM growth, and Tincture & Sublingual at 25.86% share with 430.98% YoY and 23.93% MoM growth, while Topical held 6.23% share with 67.44% MoM after an undeclared YoY baseline. Average price rose 9.04% YoY to $14.03 as Concentrates averaged $20.16 and Tincture & Sublingual $11.85, suggesting mix-driven pricing lift; SUNO’s rank of 23 in Arizona Concentrates pairs with a 41.52% mix weight, implying category scale is building faster than rank movement.
The acceleration in Tincture & Sublingual (430.98% YoY; 23.94% MoM) alongside a 26–42% mix corridor for Capsules and Concentrates indicates a three-pillar lineup where growth is increasingly pulled by value-accessible formats rather than premium-priced Concentrates, and the 67.44% MoM in Topical suggests portfolio optionality rather than core reliance. With SUNO’s Concentrates share at 41.52% but rank 23 in Arizona, the brand’s positioning leans toward breadth over category leadership, implying that future gains are more likely from deepening Tincture & Sublingual penetration and sustaining Capsules velocity than from rapid rank ascent in Concentrates.
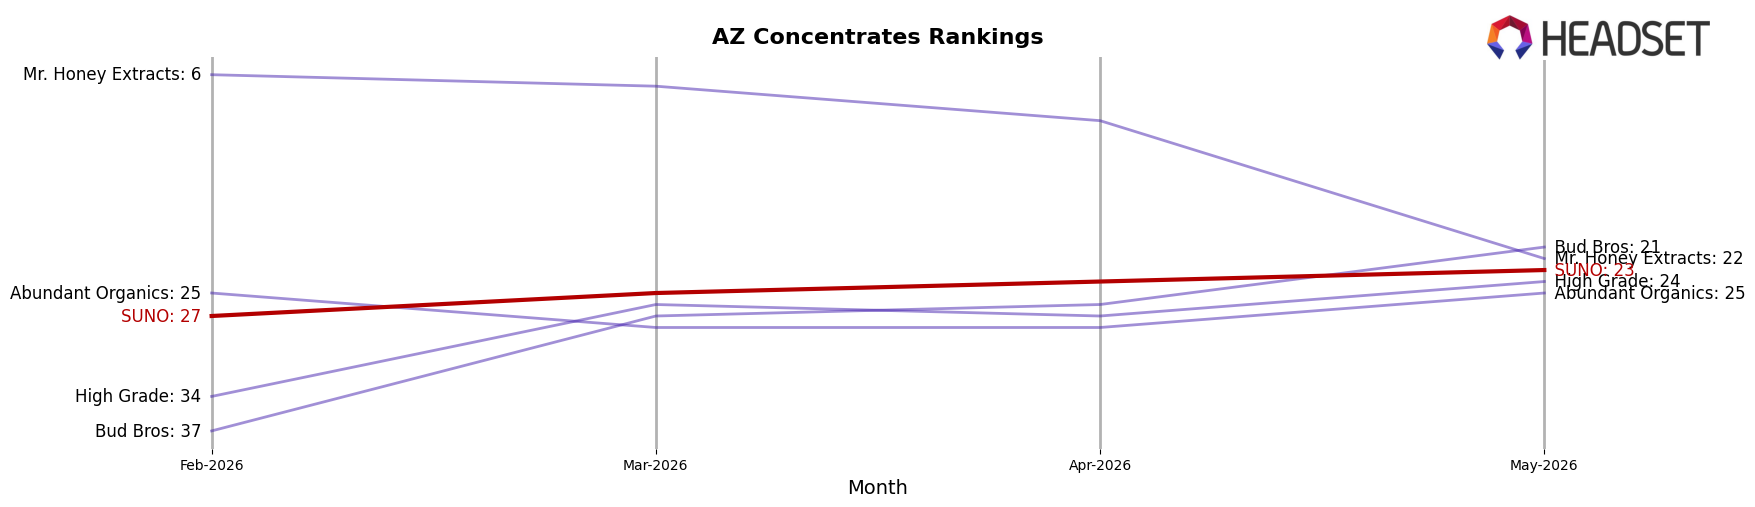
Competitive Landscape
In May 2026, SUNO holds rank #23 in AZ Concentrates, improving 15 positions from #38 year over year, while also moving up 4 spots from #27 in February 2026; this coincides with category leaders shifting, as Grow Sciences climbed from #6 to #3 with a 68.1% YoY sales increase and WTF Extracts slipped from #3 to #5 with a 10.2% YoY decline. At the very top, Mohave Cannabis Co. remained #1 despite a 6.2% YoY sales contraction, and Canamo held #2 with an 8.0% YoY drop, indicating SUNO’s ascent to a peak rank in May 2026 is occurring as incumbents give ground and mid-tier challengers consolidate gains, implying SUNO’s rank trajectory is tied to share reallocation from softening leaders and volatility among the top five.
Notable Products
CBD/CBG/THC 1:1:1 AM Tablets 10-Pack (100mg CBG, 100mg CBD, 100mg THC) posted the steepest movement in May 2026 with a -15.4% MoM decline while holding rank 9, contrasting with Hybrid Distillate (1g) up 41.6% at rank 6 and CBG/CBD/THC 1:1:1 AM Tincture (100mg CBG, 100mg CBD, 100mg THC) up 43.1% at rank 3. Three of the top four SKUs are Capsules or Tincture & Sublingual, yet Capsules split directions with Hybrid Rso Tablets 10-Pack (100mg) up 15.9% at rank 1 versus the AM Tablets decline, implying formulation and use-case drive divergence more than format alone. Concentrates advanced in tandem, with Sticky Cake RSO (1g) up 25.8% at rank 5 and category peer gains clustering between +17.3% and +41.6%, suggesting inhalable-adjacent RSO formats are absorbing demand that daytime functional capsules are losing. The pattern implies SUNO’s mix is tilting toward fast-acting concentrates and balanced tinctures, indicating a pivot away from daytime micro-dosed capsules toward higher-potency or immediate-effect options even as Capsules maintain a flagship at the top.
Top Selling Cannabis Brands
Data for this report comes from real-time sales reporting by participating cannabis retailers via their point-of-sale systems, which are linked up with Headset’s business intelligence software. Headset’s data is very reliable, as it comes digitally direct from our partner retailers. However, the potential does exist for misreporting in the instance of duplicates, incorrectly classified products, inaccurate entry of products into point-of-sale systems, or even simple human error at the point of purchase. Thus, there is a slight margin of error to consider. Brands listed on this page are ranked in the top twenty within the market and product category by total retail sales volume.

