Jun-2026
Sales
Trend
6-Month
Product Count
SKUs
Avg Price
YoY Sales Change
YoY Price Change
Market Insights Snapshot
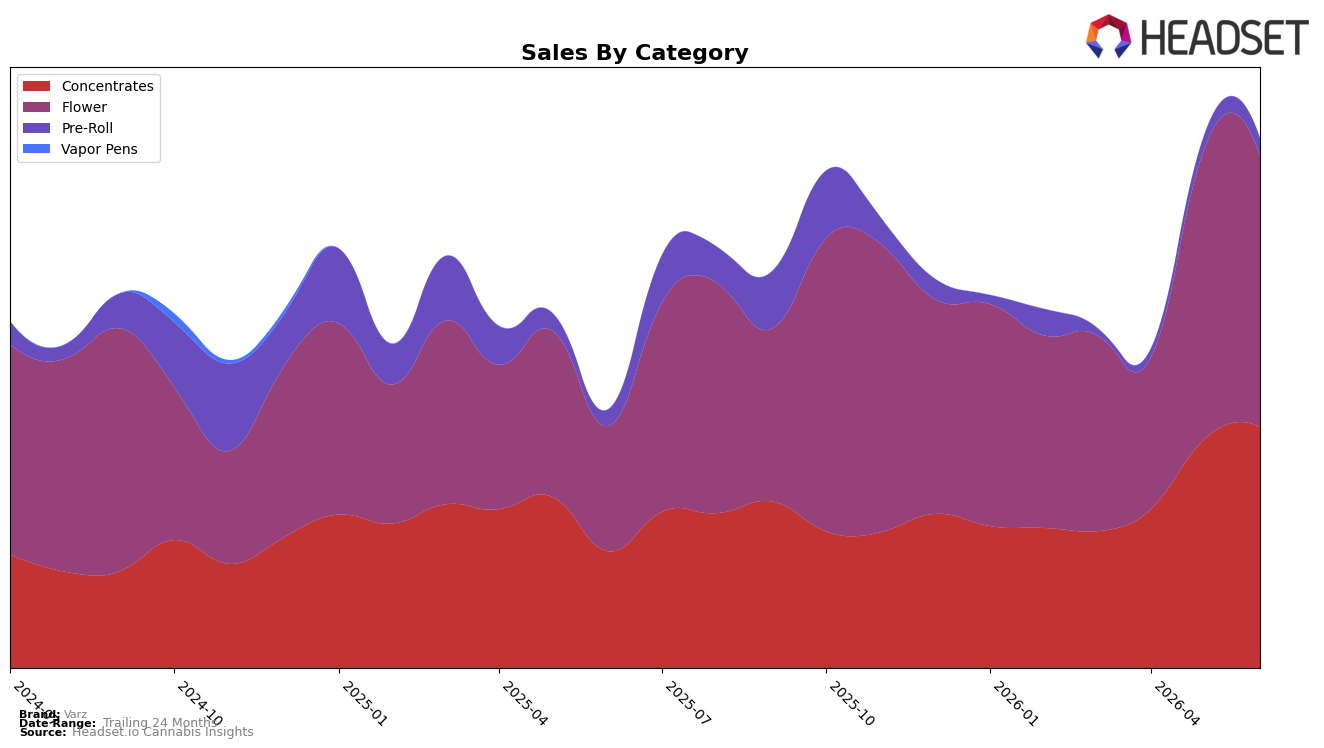
In June 2026, Varz’s mix tilted toward Flower at 51.10% share with 116.34% year-over-year growth but a 6.89% month-over-month decline, while Concentrates held 45.54% share with 106.25% year-over-year growth and a 5.20% month-over-month increase; Pre-Roll remained small at 3.37% share with 8.83% year-over-year and 24.79% month-over-month growth. Despite a 12.22% year-over-year drop in average price to $24.72, overall brand sales rose 104.96% year-over-year as category gains concentrated in Flower and Concentrates, implying Varz is scaling volume faster than price across its core segments while Pre-Roll serves as a tactical growth lever.
With Flower ranked 45 in Arizona and a 6.89% month-over-month dip alongside a 5.20% month-over-month rise in Concentrates, Varz’s positioning points to near-term emphasis on Concentrates to stabilize monthly momentum while leveraging Flower’s 116.34% year-over-year expansion for baseline volume. The combination of a 12.22% price decrease and 24.79% month-over-month uptick in Pre-Roll suggests a value-entry pathway that can feed trading up into Concentrates at a 30.38 average price, implying Varz competes on accessible price points to capture trial and then monetizes via higher-ticket formats.
Competitive Landscape
Varz is ranked #45 in Arizona Flower in June 2026, improving 14 positions from #59 year over year and 10 positions from #55 in March 2026, marking a new peak rank of #45 in June 2026. In contrast, Just Flower held #1 both year over year and in June 2026 while growing sales by 13.0%, and Mohave Cannabis Co. stayed at #3 with a -13.9% sales change, indicating Varz’s upward movement occurred while top-tier positions were stable and one leading rival contracted. This rank trajectory implies Varz is transitioning from lower-tier visibility toward the competitive mid-pack, with continued gains needed to convert rank momentum into durable share against entrenched leaders.

Notable Products
Dulce De Fresa Cold Cured Live Hash Rosin (1g) delivered the standout move in June 2026 with a month-over-month jump of 93.9% while holding rank 2, outpacing Crunch Berries (3.5g) at rank 1 with a 69.2% increase. Concentrates hold four of the top ten SKUs and include another mover, San Fernando Valley OG Cold Cured Live Hash Rosin (1g), which inched up just 0.5% at rank 6, indicating that growth is concentrated in a single hero concentrate rather than broad-based across the format. The top three ranks are split between Flower and Concentrates, with Crunch Berries (3.5g) leading at rank 1 and Sherb Cake (3.5g) at rank 3 despite no prior-month baseline, and the only cited dollar figure is $17,359 for Dulce De Fresa Cold Cured Live Hash Rosin (1g). The pattern implies Varz is shifting commercial momentum toward a flagship concentrate while Flower maintains rank leadership, suggesting product strategy should prioritize hero-batch repeats in Concentrates alongside sustaining top-tier Flower positions.
Top Selling Cannabis Brands
Data for this report comes from real-time sales reporting by participating cannabis retailers via their point-of-sale systems, which are linked up with Headset’s business intelligence software. Headset’s data is very reliable, as it comes digitally direct from our partner retailers. However, the potential does exist for misreporting in the instance of duplicates, incorrectly classified products, inaccurate entry of products into point-of-sale systems, or even simple human error at the point of purchase. Thus, there is a slight margin of error to consider. Brands listed on this page are ranked in the top twenty within the market and product category by total retail sales volume.

