.svg)
Sep-2026
Sales
Trend
6-Month
Product Count
SKUs
Avg Price
YoY Sales Change
YoY Price Change


Where to Buy
Electraleaf is stocked at 181 licensed dispensaries across New York and Massachusetts, 175 of them in New York, with the deepest coverage in New York, Brooklyn, Queens, Buffalo, and The Bronx. Search by ZIP code or city below to find the closest one, or filter by product type if you are after a specific format.
Market Insights Snapshot
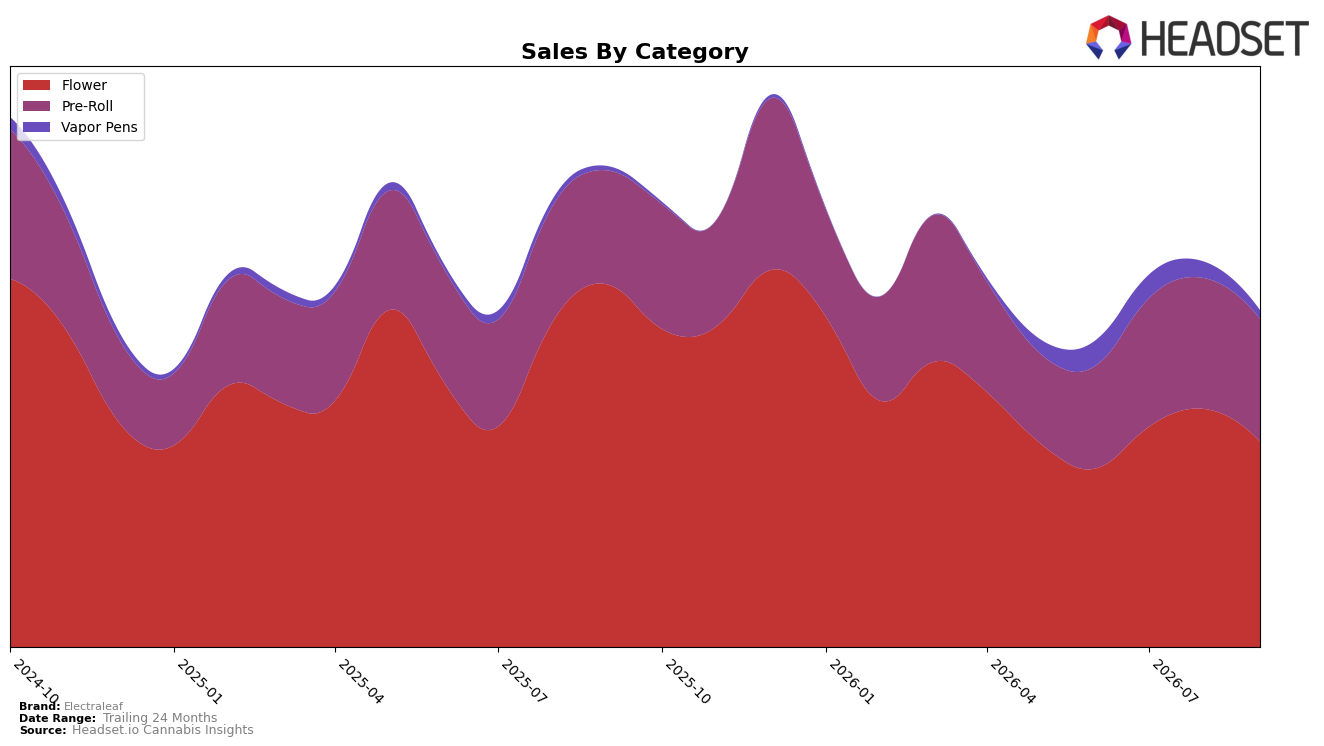
Electraleaf’s category mix in September 2026 is concentrated in Flower at 60.9% share with a year-over-year decline of 43.2% and a month-over-month drop of 13.6%, while Pre-Roll holds 36.3% share with year-over-year growth of 7.4% but a month-over-month decline of 6.2%. Vapor Pens remain a small 2.8% share despite an 89.3% year-over-year increase and a 44.7% month-over-month contraction, and the brand’s average price fell 16.4% year over year alongside total brand sales down 29.8% year over year. In New York Flower, Electraleaf ranks 27, and the combination of share concentration and mixed growth paths implies the brand is overexposed to a contracting Flower base while relying on Pre-Roll to offset declines only partially.
The shift toward Pre-Roll resilience amid Flower pressure suggests Electraleaf’s positioning is tilting from premium weight in larger-ticket Flower toward value-accessible formats where price elasticity is tighter, as indicated by a 16.4% brand-wide price decrease coexisting with a 7.4% Pre-Roll year-over-year gain. With Vapor Pens showing 89.3% year-over-year growth but only 2.8% share and a 44.7% month-over-month pullback, the current mix implies limited traction in higher-priced inhalables and a need to convert sporadic trial into sustained share so that dependence on a 60.9% Flower share and a 13.6% month-over-month Flower decline does not anchor the brand’s September 2026 trajectory.
Competitive Landscape
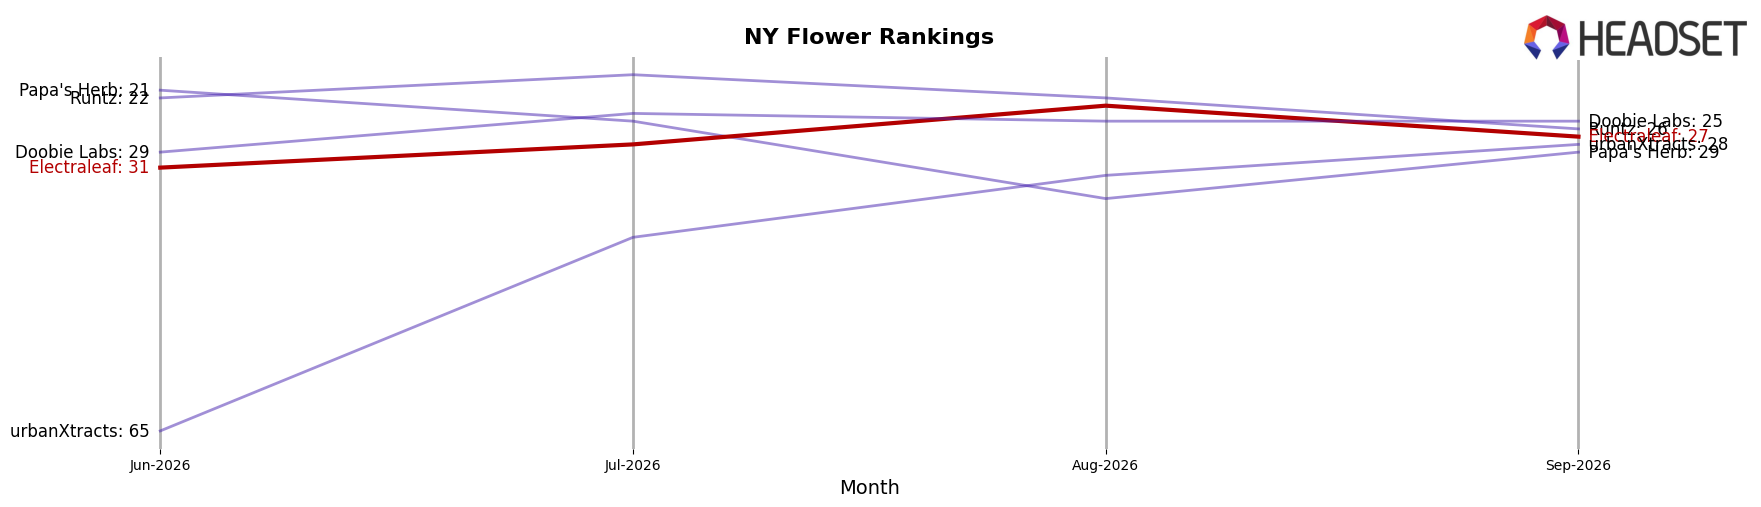
Electraleaf sits at rank #27 in New York Flower for September 2026, down 13 positions year over year from #14, yet up 4 spots from June 2026 when it was #31; this contrasts with Find. advancing to #1 from #5 and Grassroots moving to #2 from #15 alongside a 150.3% YoY sales increase. The brand’s current standing is also far from its peak of #8 in October 2024, while competitors like Untitled improved to #3 from #9 with 44.9% YoY growth and RYTHM reached #5 from #8 with 20.3% YoY growth. The pattern implies Electraleaf is losing relative velocity versus top movers whose rank gains coincide with double-digit growth rates, signaling a need to address share erosion as leaders consolidate the top 5.
Notable Products
Blue Dream Pre-Roll (1g) posted the steepest reset in September 2026 with a -59.4% MoM drop as it slipped to rank 10, while White Runtz Pre-Roll (1g) surged +55.0% MoM to rank 1, indicating buyer migration within the lineup. Cereal Milk Pre-Roll (1g) fell -37.4% MoM at rank 8 and Purple Haze Pre-Roll (1g) declined -42.1% MoM at rank 9, yet seven of the top ten are Pre-Roll SKUs, concentrating demand in a single category despite rotation among individual strains. Sharpiez (3.5g) advanced +17.0% MoM to rank 4 with $51,743 in sales, balancing the portfolio as Flower re-enters the upper tier even as Pre-Roll volatility increases. The pattern implies Electraleaf is leaning into a Pre-Roll-led strategy with selective strain winners, using a steady Flower anchor to mitigate category churn.
Top Selling Cannabis Brands






Data for this report comes from real-time sales reporting by participating cannabis retailers via their point-of-sale systems, which are linked up with Headset’s business intelligence software. Headset’s data is very reliable, as it comes digitally direct from our partner retailers. However, the potential does exist for misreporting in the instance of duplicates, incorrectly classified products, inaccurate entry of products into point-of-sale systems, or even simple human error at the point of purchase. Thus, there is a slight margin of error to consider. Brands listed on this page are ranked in the top twenty within the market and product category by total retail sales volume.

