Market Insights Snapshot
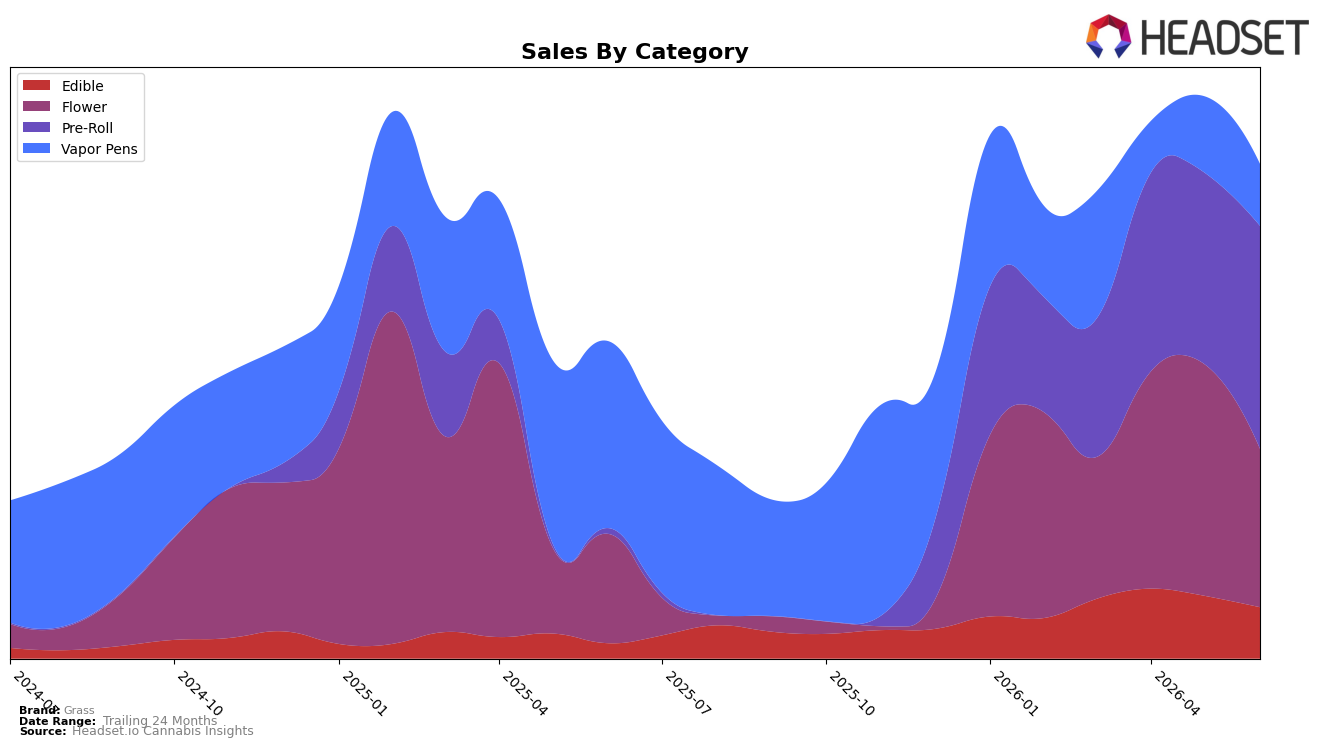
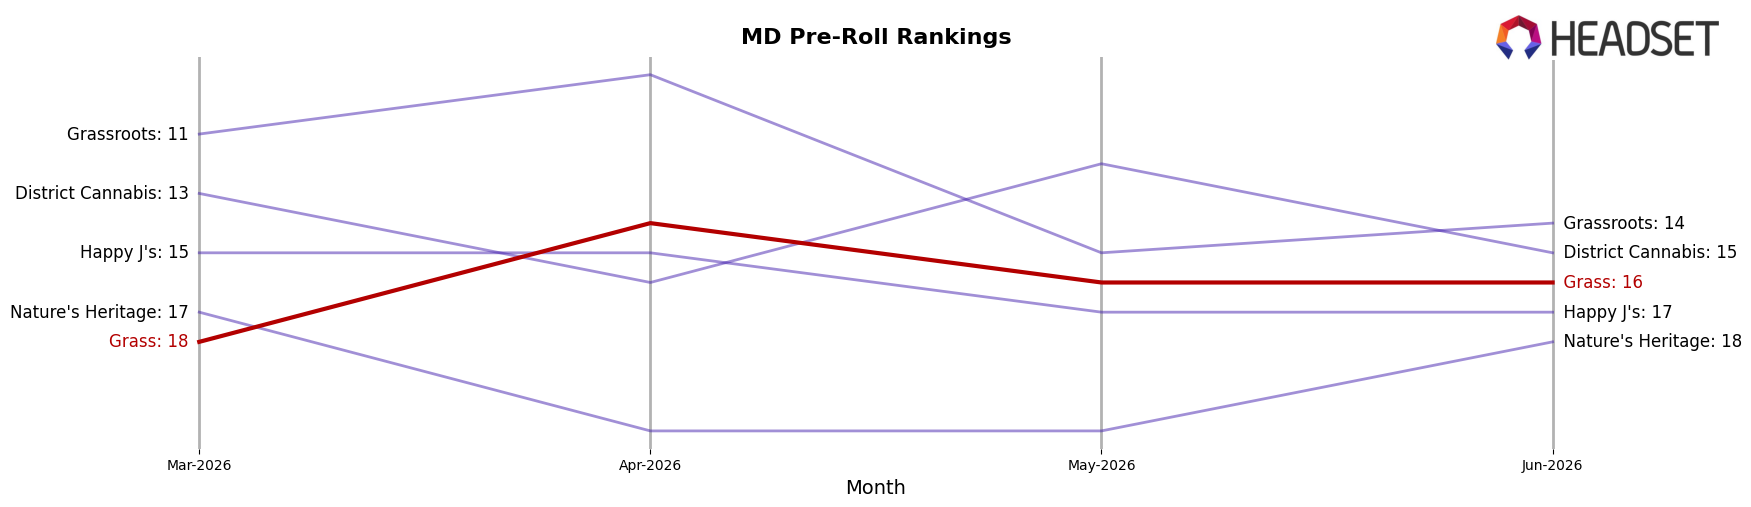
In June 2026, Grass shifted decisively into Pre-Roll, which held 45.11% share with 16.41% month-over-month growth and 3,995.33% year-over-year expansion, while Flower dropped to 32.02% share with -31.64% MoM and 44.96% YoY. Vapor Pens contracted to 12.50% share with -18.92% MoM and -66.94% YoY, and Edible accounted for 10.37% share with -18.21% MoM despite 237.36% YoY. The average price fell 50.71% YoY to $15.53 as the mix tilted toward lower-priced Pre-Roll at a $10.28 average, and rank 16 in Maryland Pre-Roll situates the brand mid-pack. The pattern implies Grass is trading assortment breadth for velocity in Pre-Roll, using price compression and a larger Pre-Roll footprint to offset declines in Vapor Pens and a monthly pullback in Flower.
The mix pivot implies a positioning move toward value-led inhalables anchored by Pre-Roll, where a 16.41% MoM gain and 3,995.33% YoY rise suggest repeatable unit throughput at lower prices, while the -31.64% MoM in Flower and -18.92% MoM in Vapor Pens indicate deprioritization of higher ticket formats. Holding 45.11% of brand sales in Pre-Roll alongside a 10.37% Edible contribution with -18.21% MoM suggests secondary categories are being used opportunistically rather than as growth engines. With rank 16 in Maryland Pre-Roll and a 50.71% YoY price decline, the thesis is that Grass is optimizing for share capture in volume-heavy segments now, while accepting near-term softness in premium formats to stabilize overall growth.
Competitive Landscape
Grass sits at rank #16 in MD Pre-Roll in June 2026, improving 35 positions from #51 year over year, and narrowing the gap from #18 in March 2026 while remaining below its peak of #14 in April 2026; by contrast, SunMed advanced to #1 from #4 with 76.6% YoY sales growth, and Curio Wellness slid to #5 from #2 with a 48.2% YoY sales decline, indicating Grass is gaining rank share against weakening incumbents but still trails leaders anchored in the top 3—implying the current upward trajectory is sustainable if Grass converts April 2026’s #14 peak into consistent month-to-month rank wins.
Notable Products
Meteor Kush Pre-Roll 2-Pack (1g) posted the most dramatic move in June 2026 with +324.5% MoM to rank 2, while Headspace Pre-Roll 2-Pack (1g) rose +153.7% MoM to rank 1, indicating a reshuffle concentrated at the top rather than broad-based lift. In contrast, CBN/THC 2:1 Bay Berry Gummies 10-Pack (200mg CBN, 100mg THC) fell -46.2% MoM at rank 4, and Halo Kush Pre-Roll 2-Pack (1g) declined -21.9% MoM at rank 10, creating polarization between fast-rising flagships and laggards. Four of the top ten are Pre-Roll SKUs clustered in the top three and ranks 5–10, and Baltimore Crush Gummies 10-Pack (100mg) held rank 3 with +1.9% MoM and $35,221 in sales, signaling that Pre-Rolls are becoming the volume anchor while edibles play a steadier, secondary role. The pattern implies Grass is leaning into rapid-turn Pre-Rolls for share capture while pruning or repositioning niche functional edibles to reduce volatility.
Top Selling Cannabis Brands
Data for this report comes from real-time sales reporting by participating cannabis retailers via their point-of-sale systems, which are linked up with Headset’s business intelligence software. Headset’s data is very reliable, as it comes digitally direct from our partner retailers. However, the potential does exist for misreporting in the instance of duplicates, incorrectly classified products, inaccurate entry of products into point-of-sale systems, or even simple human error at the point of purchase. Thus, there is a slight margin of error to consider. Brands listed on this page are ranked in the top twenty within the market and product category by total retail sales volume.

