.svg)

Aug-2026
Sales
Trend
6-Month
Product Count
SKUs
Avg Price
YoY Sales Change
YoY Price Change


Where to Buy
Tall Tree Society is stocked at 25 licensed dispensaries across California, with the deepest coverage in Los Angeles, San Jose, Santa Rosa, Berkeley, and Corona. Search by ZIP code or city below to find the closest one, or filter by product type if you are after a specific format.
Market Insights Snapshot
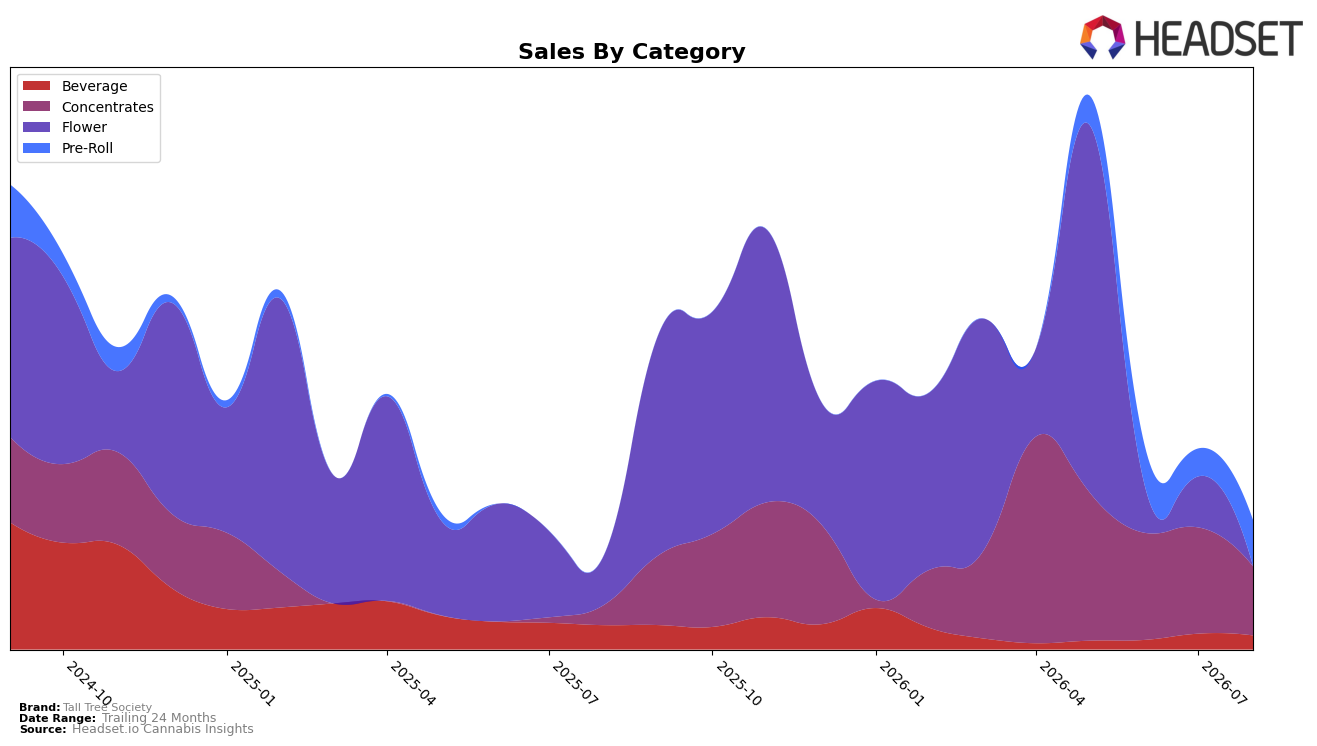
In August 2026, Tall Tree Society concentrated 53.61% of sales in Concentrates with a 245.66% year-over-year change but a 35.19% month-over-month decline, while Pre-Roll rose to 35.63% share on a 65.19% month-over-month increase and Beverage fell to 10.76% share with a 42.73% year-over-year decline. Despite overall brand sales up 37.12% year over year and average price up 18.82%, Concentrates’ month-over-month pullback alongside Pre-Roll’s sequential surge indicates a pivot in mix that lifted unit velocity outside of Concentrates in California, implying the brand is trading some Concentrates volume for faster-turning Pre-Rolls while Beverage continues to contract.
The shift toward Pre-Roll on a 65.19% month-over-month rise and away from Beverage with an 11.43% month-over-month decline, combined with a 35.19% month-over-month dip in Concentrates, implies Tall Tree Society is repositioning around accessible formats at lower price points than the $36.27 average in Concentrates. With 24-month sales down 70.51% but August 2026 year-over-year sales up 37.12%, the current mix suggests recovery is being driven by near-term format elasticity rather than category leadership in Concentrates, which could weaken differentiation if the brand lacks a clear rank signal in Concentrates in California.
Competitive Landscape
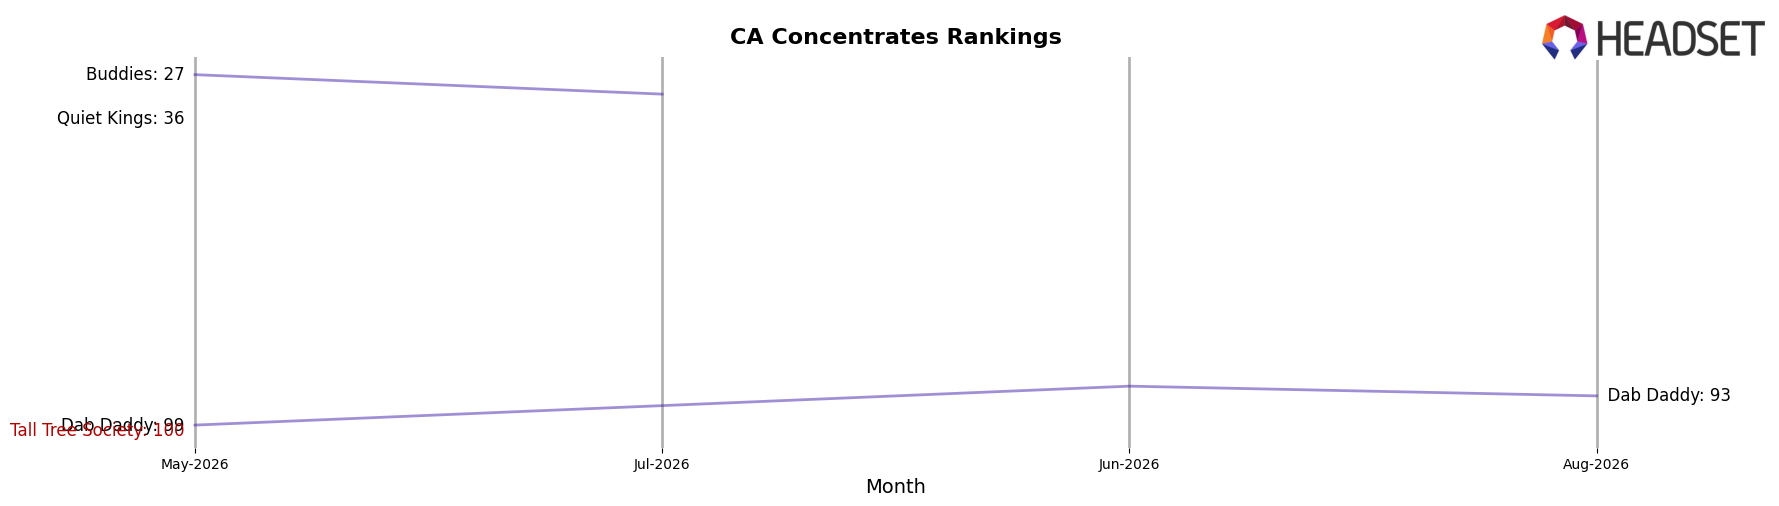
Tall Tree Society sits at rank 128 in California Concentrates for August 2026, improving 57 positions from rank 185 year over year, but sliding 28 spots from rank 100 in May 2026 after peaking at rank 83 in April 2026. Against leading competitors, Raw Garden held rank 1 with 9.89% year-over-year sales growth while 710 Labs climbed from rank 4 to rank 2 alongside 33.52% year-over-year growth, indicating Tall Tree Society’s relative decline from its April 2026 peak reflects lost momentum versus ascending leaders despite a 57-rank year-over-year recovery.
Notable Products
Shishkaberry Pre-Roll (2g) delivered the standout move in August 2026 with a +231% month-over-month surge to rank 1, while Dark Berry Seltzer (5mg THC, 12oz) slid -11% to rank 2. Concentrates dominated breadth with at least five of the top ten SKUs in that category, yet performance inside the segment skewed down as Lavender Oasis Cold Cured Rosin (1g) fell -73% to rank 5 and Banana Sorbet Bubble Hash (2g) plunged -93% to rank 7. The mix implies Tall Tree Society is tilting toward scalable Pre-Roll velocity at the top while rebalancing underperforming Concentrates that are losing rank and momentum.
Top Selling Cannabis Brands






Data for this report comes from real-time sales reporting by participating cannabis retailers via their point-of-sale systems, which are linked up with Headset’s business intelligence software. Headset’s data is very reliable, as it comes digitally direct from our partner retailers. However, the potential does exist for misreporting in the instance of duplicates, incorrectly classified products, inaccurate entry of products into point-of-sale systems, or even simple human error at the point of purchase. Thus, there is a slight margin of error to consider. Brands listed on this page are ranked in the top twenty within the market and product category by total retail sales volume.

