Jun-2026
Sales
Trend
6-Month
Product Count
SKUs
Avg Price
YoY Sales Change
YoY Price Change
Market Insights Snapshot
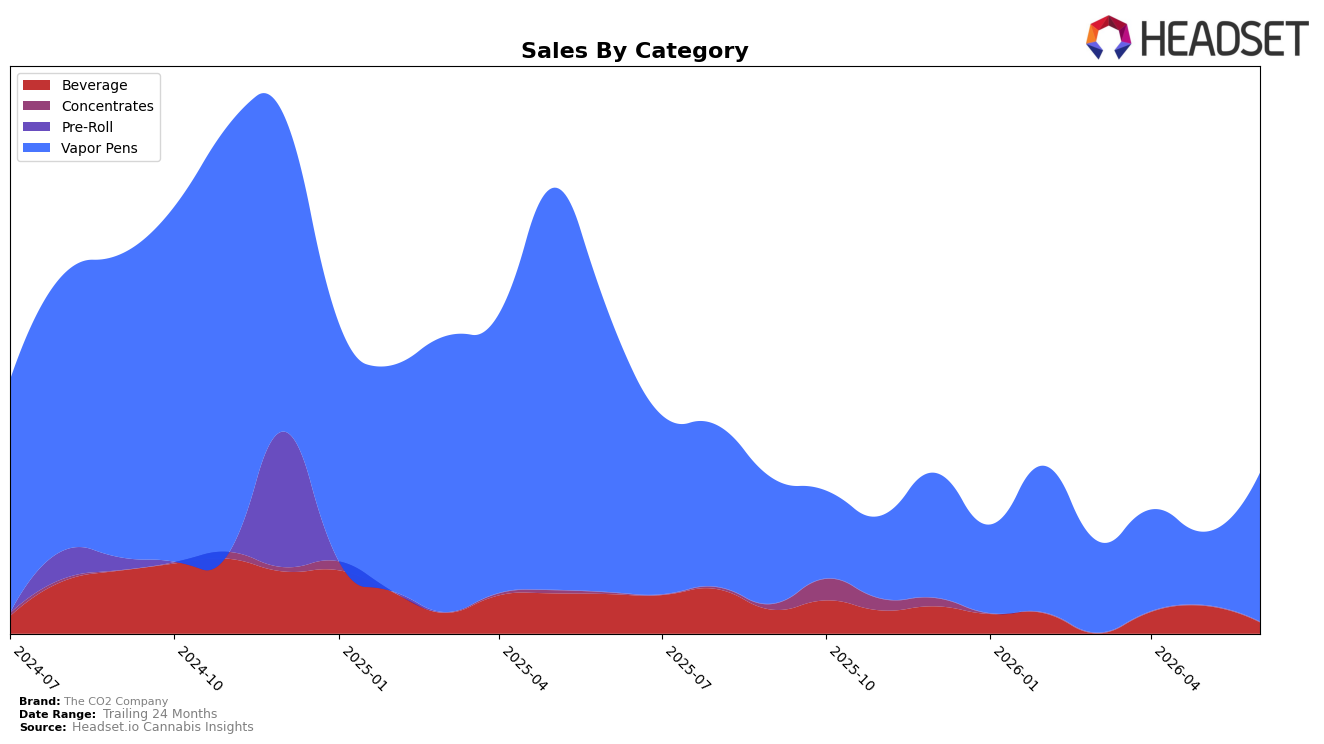
In June 2026, The CO2 Company concentrated 93.10% of sales in Vapor Pens, with Beverage at 6.90%, while overall brand sales fell 50.20% year over year and rose 103.67% month over month in Vapor Pens against a 60.04% month-over-month drop in Beverage. Vapor Pens declined 46.91% year over year but expanded share via a sharp monthly rebound, whereas Beverage contracted 72.00% year over year and ceded mix, implying the category portfolio is narrowing toward Vapor Pens as the primary revenue engine despite a 22.91% year-over-year increase in average price to $19.41.
This mix shift places The CO2 Company as a price-firming, Vapor Pen–led player competing at rank 78 in Vapor Pens in Colorado, where the 103.67% monthly surge suggests short-cycle responsiveness that Beverage lacks amid a 60.04% monthly decline. The combination of a 46.91% Vapor Pen year-over-year drop and 72.00% Beverage decline indicates a defensive posture around a single lead category, implying that near-term share gains will depend on sustaining Vapor Pen velocity while Beverage either stabilizes or is deemphasized to protect margin and ranking.
Competitive Landscape
The CO2 Company sits at rank #78 in CO Vapor Pens in June 2026, improving 5 positions from #83 year over year and up 14 spots from #92 three months ago, while still trailing its peak of #73 last reached in May 2025; in contrast, Spherex held at #1 after moving up from #2 as its sales fell 9.6% year over year, and PAX climbed from #3 to #2 on 22.5% YoY sales growth, indicating that The CO2 Company’s modest rank gains are occurring amid leaders that either consolidate despite declines or accelerate with double-digit growth—implying a gradual, catch-up trajectory rather than a breakout path unless rank momentum exceeds the prior peak range.

Notable Products
Mango Syrup (1000mg) posted a -60.0% month-over-month drop in June 2026 while falling to rank 4, contrasting with Super Lemon Haze Oil Disposable (1g) up 43.4% at rank 1 and Tangerine Haze Oil Disposable (1g) up 31.2% at rank 2; this divergence indicates demand is consolidating away from Beverage toward Vapor Pens. Banana Kush Oil Disposable (1g) climbed 46.2% to rank 3 while Super Lemon Haze Oil Disposable (1g) and Tangerine Haze Oil Disposable (1g) held the top two spots, meaning three of the top four are Vapor Pens and Vapor Pens account for at least three of the top five ranks; the $838 in Mango Syrup (1000mg) sales did not offset its rank pressure. The pattern implies The CO2 Company’s commercial direction is pivoting toward disposable Vapor Pens as the core volume engine while beverage formats recede in priority.
Top Selling Cannabis Brands
Data for this report comes from real-time sales reporting by participating cannabis retailers via their point-of-sale systems, which are linked up with Headset’s business intelligence software. Headset’s data is very reliable, as it comes digitally direct from our partner retailers. However, the potential does exist for misreporting in the instance of duplicates, incorrectly classified products, inaccurate entry of products into point-of-sale systems, or even simple human error at the point of purchase. Thus, there is a slight margin of error to consider. Brands listed on this page are ranked in the top twenty within the market and product category by total retail sales volume.

