May-2026
Sales
Trend
6-Month
Product Count
SKUs
Avg Price
YoY Sales Change
YoY Price Change
Market Insights Snapshot
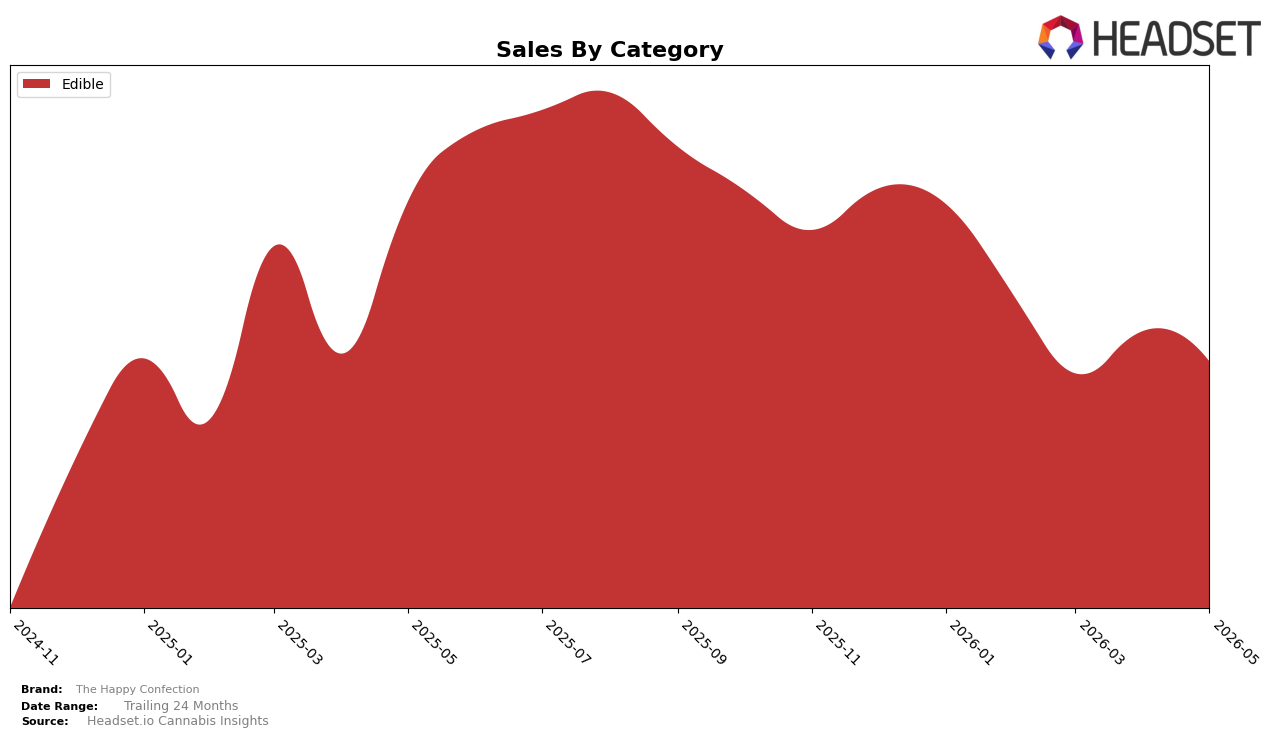
In May 2026, The Happy Confection operated as a single-category brand with Edible accounting for a 100.0% mix, while year-over-year sales declined by 38.4% and month-over-month sales fell 10.7%. Average price moved down 29.8% YoY to $24.33, a pricing contraction that outpaced the 10.7% MoM sales drop and coincided with an 8th-place rank in Edible in Connecticut; the pattern implies that discounting has not converted into proportional volume gains.
With Edible concentration at 100.0% alongside a 38.4% YoY decline and an 8th-place rank in Connecticut, The Happy Confection’s positioning is tied to a single demand pocket where price cuts of 29.8% YoY have not arrested share erosion. The combination of a 10.7% MoM sales decline against a lower $24.33 average price suggests elasticity that is weaker than expected, implying the brand competes on factors other than price within Edible and would benefit from either premiumization or targeted assortment shifts rather than further markdowns.
Competitive Landscape
The Happy Confection sits at #8 in CT Edible in May 2026, down 3 spots year over year from #5, and also down 1 rank quarter over quarter from #7, while its historical peak was #4 in June 2025 and the current leader Soundview rose year over year from #2 to #1 with 29.3% sales growth and Camino climbed from #6 to #2 with 383.6% sales growth; in contrast, Encore Edibles slipped from #1 to #4 with a 56.2% sales decline, indicating that The Happy Confection’s 3-rank YoY slide alongside competitors’ upward moves compresses headroom and implies a need to reverse share loss to avoid further mid-pack drift.

Notable Products
CBD/CBN/THC 2:2:1 Catching Citrus Dreams Gummies 20-Pack (100mg CBD, 100mg THC, 50mg CBN) posted the largest movement in May 2026 with +168.5% MoM, while CBD/CBG/THC 2:1:1 Sultry Cinnamon Medium Dose Live Resin Gummies 20-Pack (200mg CBD, 100mg CBG, 100mg THC) climbed +96.4% MoM to rank 2. In contrast, THCV/THC 1:1 Creative Clementine Micro Dose Gummies 20-Pack (100mg THCV, 100mg THC) led the chart at rank 1 despite a -12.6% MoM drop and CBD/CBG/THC 1:1:1 Coasting Cherry Punch Medium Dose Gummies 20-Pack (100mg CBD, 100mg CBG, 100mg THC) fell -33.4% to rank 3. Seven of the top ten are Edible SKUs, and sleep/relief-leaning formulations outpaced general micro-dose options as CBD/CBN/THC 2:2:1 Sleepy Citron Micro Dose Gummies 20-Pack (50mg CBD, 50mg THC, 25mg CBN) gained +89.8% while Boosted Berry High Dose Gummies 20-Pack (500mg) slipped -46.8% with $4,640 in May 2026 sales. The mix points to The Happy Confection pivoting toward efficacy-forward cannabinoid blends that convert better than flavor-led or high-dose SKUs, implying resource allocation toward functional formulations could accelerate share within Edibles.
Top Selling Cannabis Brands
Data for this report comes from real-time sales reporting by participating cannabis retailers via their point-of-sale systems, which are linked up with Headset’s business intelligence software. Headset’s data is very reliable, as it comes digitally direct from our partner retailers. However, the potential does exist for misreporting in the instance of duplicates, incorrectly classified products, inaccurate entry of products into point-of-sale systems, or even simple human error at the point of purchase. Thus, there is a slight margin of error to consider. Brands listed on this page are ranked in the top twenty within the market and product category by total retail sales volume.

