Jun-2026
Sales
Trend
6-Month
Product Count
SKUs
Avg Price
YoY Sales Change
YoY Price Change
Market Insights Snapshot
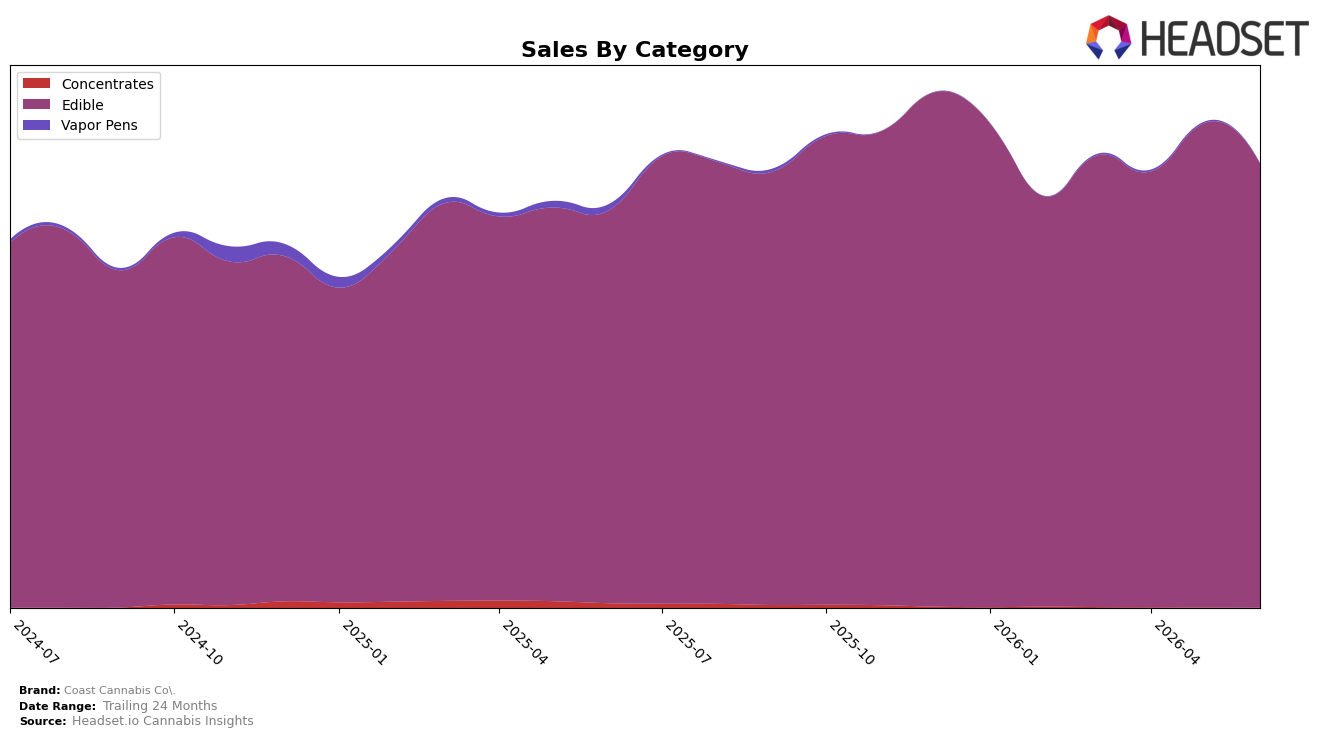
In June 2026, Coast Cannabis Co. remained a single-category brand with Edible accounting for 100.0% of sales, pairing a year-over-year sales increase of 13.19% with a month-over-month decline of 8.30%. The brand’s overall sales grew 10.31% year over year while average price fell 4.70%, indicating unit growth outpacing revenue growth and a negative price-mix drag inside Edible. With average price at $21.66 and Edible concentration at 100.0%, the pattern implies reliance on Edible scale for growth while recent month pressure and lower pricing signal sensitivity to promotional intensity rather than cross-category diversification.
Ranked 5 in Edible in Connecticut, Coast Cannabis Co. is positioned as a second-tier contender rather than a top-3 leader, and the 8.30% month-over-month pullback combined with a 13.19% year-over-year lift suggests share stabilization rather than share gain in the near term. The 22.41% two-year sales expansion alongside a 4.70% average price decline points to a volume-led play that can defend rank but may cap premium perception, and the 100.0% Edible dependency narrows defensive options if category momentum cools. The implication is that sustaining a top-5 rank will likely require either price recovery within Edible or selective mix broadening to buffer against monthly volatility while preserving the volume engine.
Competitive Landscape
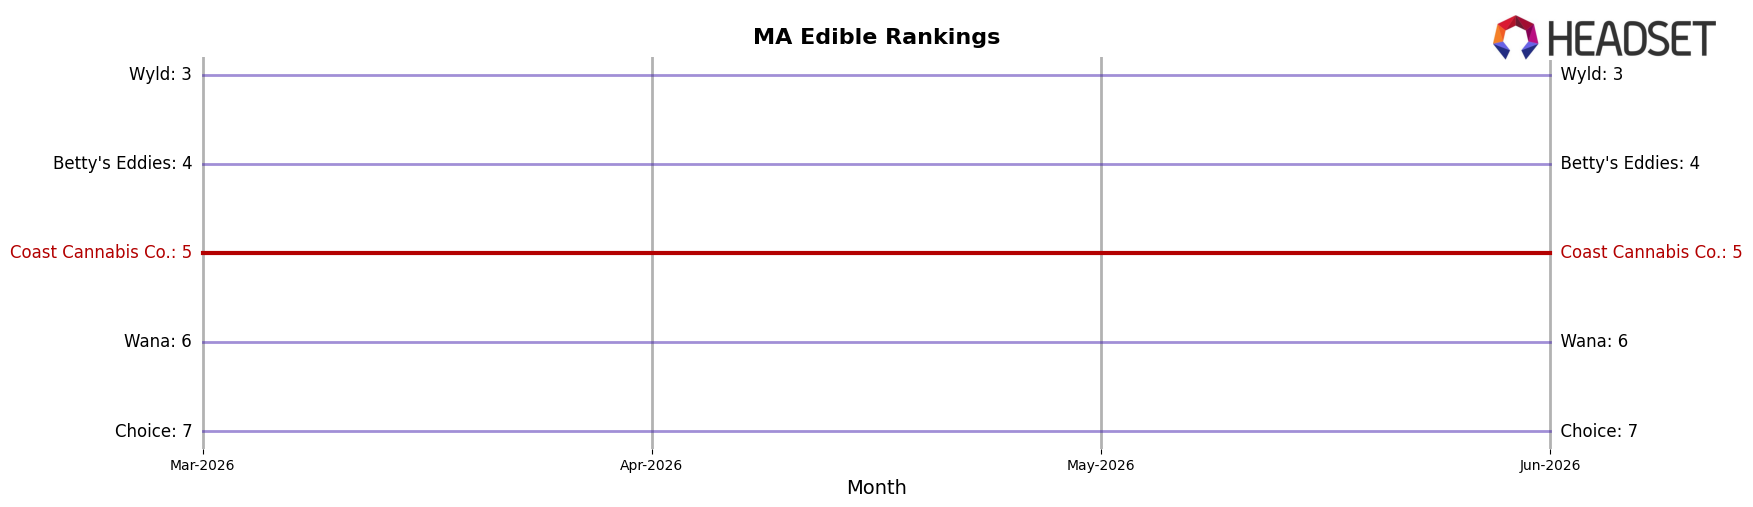
Coast Cannabis Co. sits at rank #5 in MA Edible in June 2026, up 1 position from #6 year over year, with rank stability over the last three months at #5 indicating a plateau rather than momentum; meanwhile, Kanha / Sunderstorm moved to #1 from #2 with sales up 20.0% year over year, and Wyld advanced to #3 from #5 while growing 40.5% year over year, outpacing Betty's Eddies which slipped to #4 from #3 with a 2.9% decline; against that backdrop, Coast Cannabis Co.’s 1-rank YoY gain alongside a peak rank of #5 in June 2026 implies it is holding share but not breaking into the top-three growth tier.
Notable Products
CBD/THC/THCV 1:1:1 Raspberry Lime Gummies 20-Pack (100mg CBD, 100mg THC, 100mg THCV) posted a -20.5% month-over-month change in June 2026 while holding rank 4, and CBN/THC 5:1 Goodnight Grape Gummies 20-Pack (500mg CBN, 100mg THC) fell -13.4% at rank 1. In contrast, Relax - CBD/THC 2:1 Cherry Gummies 20-Pack (200mg CBD, 100mg THC) rose 23.7% at rank 6, but seven of the top ten SKUs were still down between -7.3% and -20.5%. With all top-10 items in Edibles and three functional blends in the top three positions, the pattern implies a consolidation around sleep and balanced-effect gummies while value-sensitive segments ease back, pointing Coast Cannabis Co. toward defending flagship sleep blends and reevaluating multi-cannabinoid novelty lines.
Top Selling Cannabis Brands
Data for this report comes from real-time sales reporting by participating cannabis retailers via their point-of-sale systems, which are linked up with Headset’s business intelligence software. Headset’s data is very reliable, as it comes digitally direct from our partner retailers. However, the potential does exist for misreporting in the instance of duplicates, incorrectly classified products, inaccurate entry of products into point-of-sale systems, or even simple human error at the point of purchase. Thus, there is a slight margin of error to consider. Brands listed on this page are ranked in the top twenty within the market and product category by total retail sales volume.

