Market Insights Snapshot
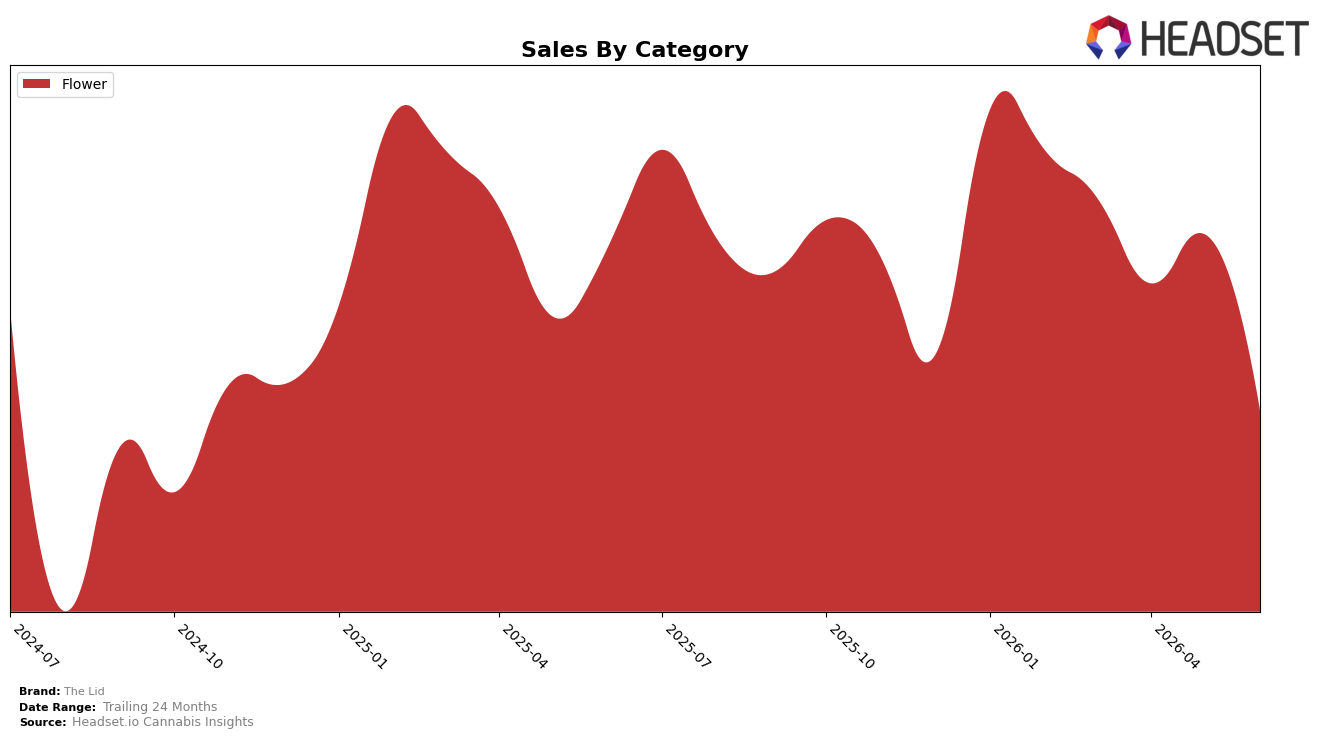
In June 2026, The Lid operated as a single-category brand with Flower at 100.0% mix, posting a year-over-year sales change of -30.7% and a month-over-month decline of -32.3%. Average price fell -19.4% YoY to $65.45 while share remained consolidated at 100.0%, and the brand held rank 23 in Flower within New Jersey. The combination of a steeper MoM contraction than YoY alongside a double-digit price drop implies that recent demand or distribution pressure intensified in June, compressing revenue faster than pricing alone can explain.
The all-in Flower concentration at 100.0% paired with a rank of 23 and a -30.7% YoY versus -32.3% MoM trajectory suggests exposure to month-specific volatility and limited insulation from category shifts. With price down -19.4% YoY while sales contracted over -30%, the gap indicates mix or velocity losses beyond discounting, meaning The Lid’s positioning in New Jersey Flower relies on improving sell-through at current price tiers or adding adjacent formats to smooth short-term shocks.
Competitive Landscape
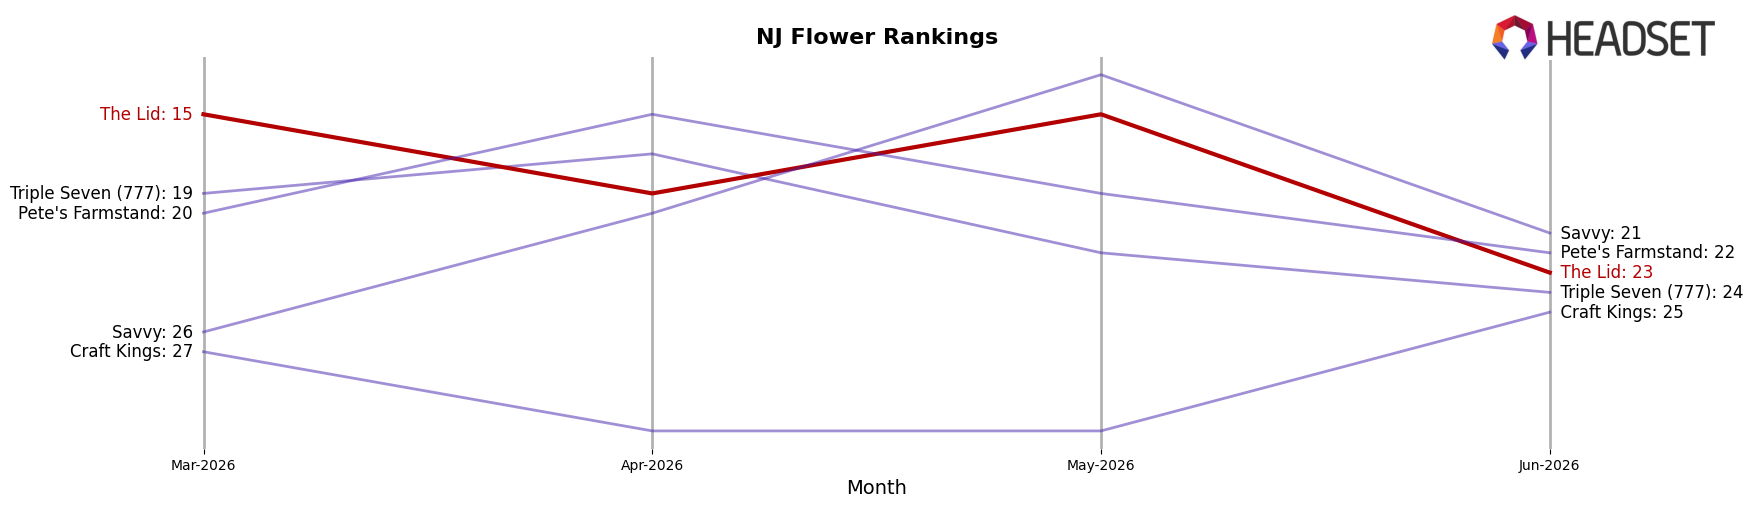
The Lid sits at rank #23 in New Jersey Flower in June 2026, sliding 6 positions year over year from #17 and down 8 spots from March 2026’s #15, even after peaking at #9 in January 2026; meanwhile, Find. vaulted from #12 to #1 with 225.99% YoY sales growth and Ozone held near the top at #2 despite a -10.61% YoY decline, indicating that gains at the top are consolidating while mid-tier ranks are becoming less forgiving—The Lid’s downward trajectory implies share is being redistributed toward brands with sharper momentum or better retention, and a continued slide risks exiting the top 25 if June’s rank does not stabilize.
Notable Products
Somerdale Sherb Pre Ground (14g) posted the standout movement in June 2026 with a +125% month-over-month surge and took rank 1, while West Orange Oreoz Pre Ground (14g) fell -57% and sat at rank 7, indicating a sharp rotation within the lineup. Deptford Diesel Pre Ground (14g) also declined -40% at rank 4, and four of the top ten are Pre Ground 14g SKUs, concentrating demand in a single pack-size format. Trenton Trop Pre Ground (14g) secured rank 2 without a reported MoM figure, suggesting momentum behind pre-ground value even beyond the top mover.
The pattern implies The Lid is consolidating around value-forward pre-ground offerings, where volatility at ranks 1 and 7 signals active trial-and-switch behavior that favors winners with rapid repeat potential over slower-turning strains.
Top Selling Cannabis Brands
Data for this report comes from real-time sales reporting by participating cannabis retailers via their point-of-sale systems, which are linked up with Headset’s business intelligence software. Headset’s data is very reliable, as it comes digitally direct from our partner retailers. However, the potential does exist for misreporting in the instance of duplicates, incorrectly classified products, inaccurate entry of products into point-of-sale systems, or even simple human error at the point of purchase. Thus, there is a slight margin of error to consider. Brands listed on this page are ranked in the top twenty within the market and product category by total retail sales volume.

