Jun-2026
Sales
Trend
6-Month
Product Count
SKUs
Avg Price
YoY Sales Change
YoY Price Change
Market Insights Snapshot
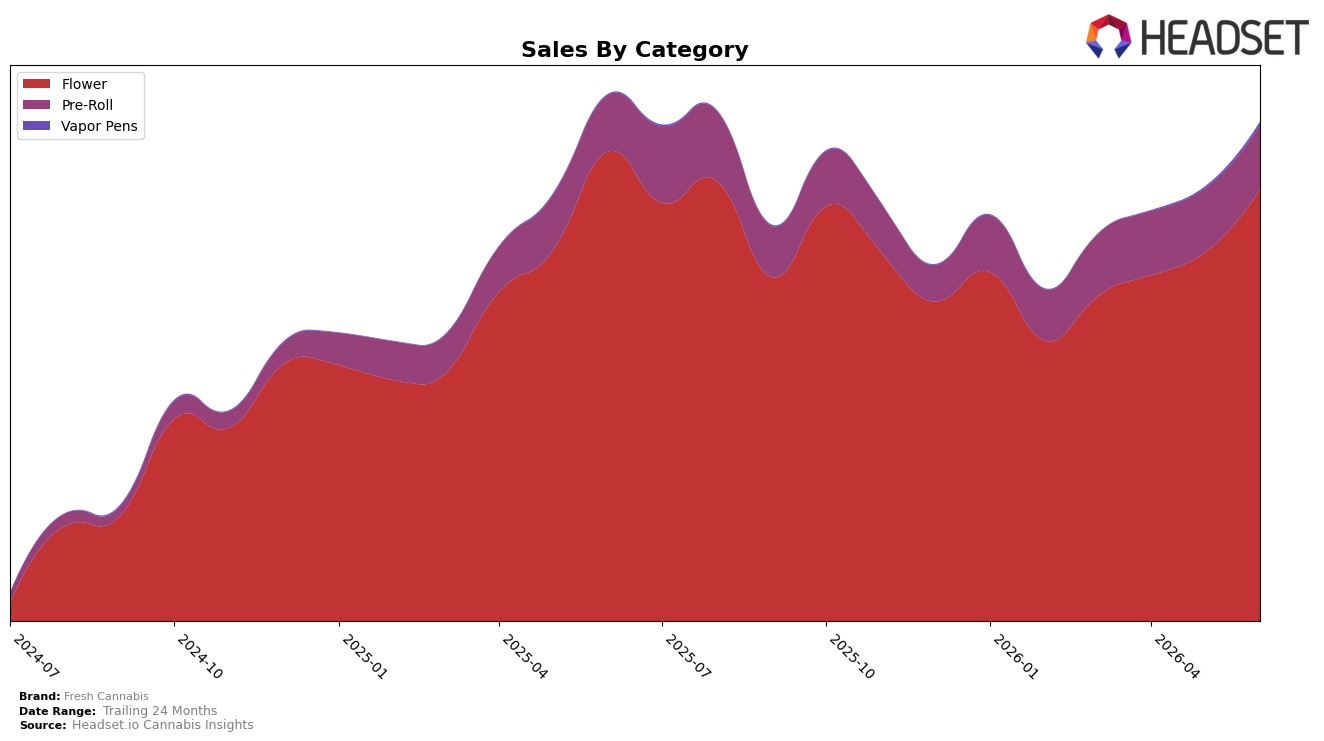
Fresh Cannabis concentrated 86.55% of June 2026 sales in Flower, where year-over-year sales fell 8.06% while month-over-month rose 17.21%, and the brand held rank 16 in Flower within New Jersey; meanwhile, Pre-Roll accounted for 12.83% share with 13.27% YoY growth but only 0.05% MoM, and Vapor Pens, though just 0.62% share, surged 405.33% YoY and 112.75% MoM. Against an average price down 20.50% YoY to $17.83 and total brand sales down 5.29% YoY, the mix indicates reliance on a recovering Flower base while early traction in Vapor Pens offers outsized growth optionality; the implication is that sustaining the MoM momentum in Flower while nurturing the sub-1% Vapor Pens niche could rebalance growth without overexposing the portfolio to a single category.
The combination of an 8.06% YoY decline in the 86.55% Flower anchor and a 13.27% YoY gain in the 12.83% Pre-Roll slice suggests price-led competitiveness is pulling units but diluting revenue per unit, while the 112.75% MoM spike in the 0.62% Vapor Pens line signals responsive demand to recent assortment or pricing changes. With rank 16 in New Jersey Flower and a 17.21% MoM Flower uptick, the near-term path points to defending Flower position through disciplined pricing while expanding higher-velocity Pre-Roll and scaling Vapor Pens from a low base; the thesis is that modest share reallocation from Flower toward faster-growing, lower-price segments can counter the 5.29% YoY brand sales decline without eroding category presence.
Competitive Landscape
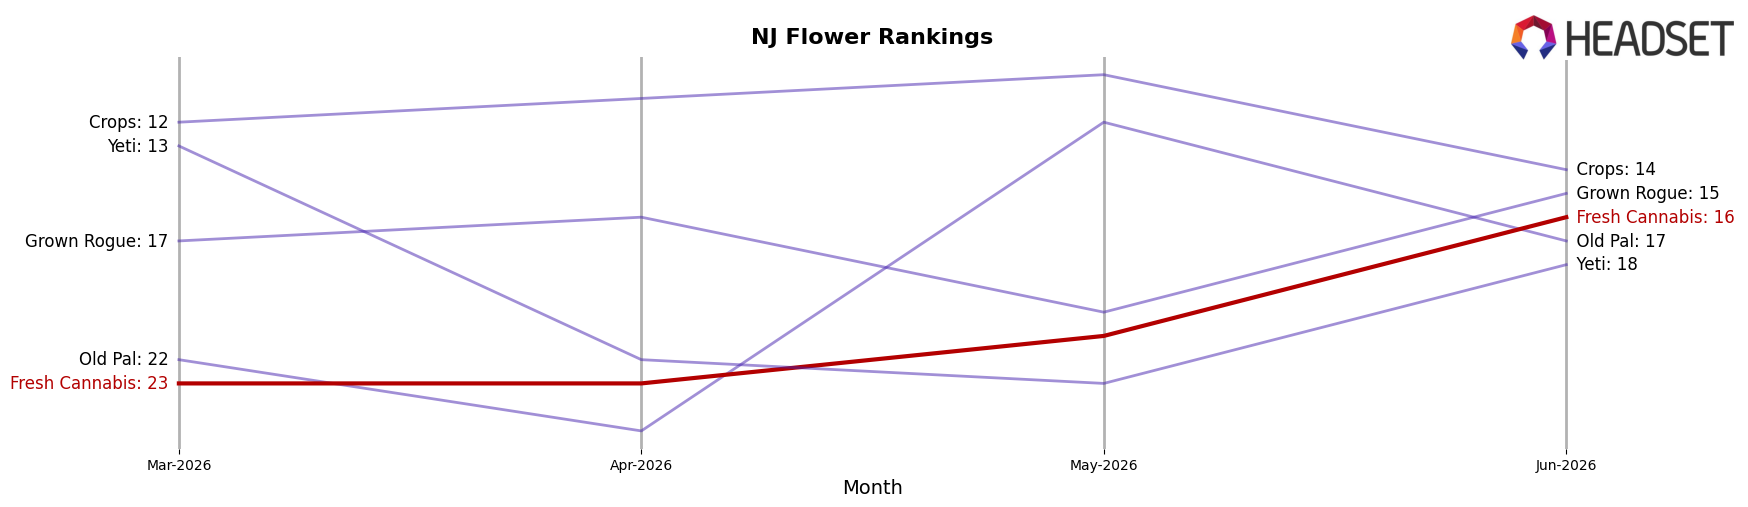
Fresh Cannabis sits at rank #16 in New Jersey Flower in June 2026, down 1 position year over year from #15, but up 7 places versus March 2026 when it was #23; the brand’s peak of #15 in July 2025 underscores a one-rank slippage over twelve months while the recent quarter-on-quarter climb signals near-term recovery. Meanwhile, Find. jumped from #12 to #1 with an estimated 225.99% year-over-year sales increase, and Good Green moved from #11 to #3 alongside an 88.63% sales lift, whereas Ozone held near the top at #2 despite a -10.61% sales decline; this competitive shape—leaders advancing multiple ranks while a top-3 incumbent posts negative growth—implies Fresh Cannabis’s slight YoY rank dip amid a 7-place three-month gain is more about accelerated competitor ascent than internal collapse, setting a trajectory that requires share capture from fast-climbing rivals to re-enter the top 15.
Notable Products
Fresh Cannabis’s McGlovin (3.5g) posted the standout movement in June 2026 with a +623.8% month-over-month surge while holding rank 6, eclipsing the next-fastest mover Miracle Alien Cookies (3.5g) at +37.1% in rank 7. Animal Face x Kush Mints (3.5g) rose a modest +2.1% at rank 3, and nine of the top ten SKUs are Flower, concentrating share in a single category despite rank positions spanning 1 through 10. With Modern Marvel (3.5g) entrenched at rank 1 and The Flag (3.5g) at rank 2 alongside McGlovin’s outsized jump and Miracle Alien Cookies’ double-digit lift, the pattern implies Fresh Cannabis is leaning into a Flower-led portfolio where a few volatile SKUs can swing trajectory even as the category core anchors stability.
Top Selling Cannabis Brands
Data for this report comes from real-time sales reporting by participating cannabis retailers via their point-of-sale systems, which are linked up with Headset’s business intelligence software. Headset’s data is very reliable, as it comes digitally direct from our partner retailers. However, the potential does exist for misreporting in the instance of duplicates, incorrectly classified products, inaccurate entry of products into point-of-sale systems, or even simple human error at the point of purchase. Thus, there is a slight margin of error to consider. Brands listed on this page are ranked in the top twenty within the market and product category by total retail sales volume.

