.svg)


Market Insights Snapshot
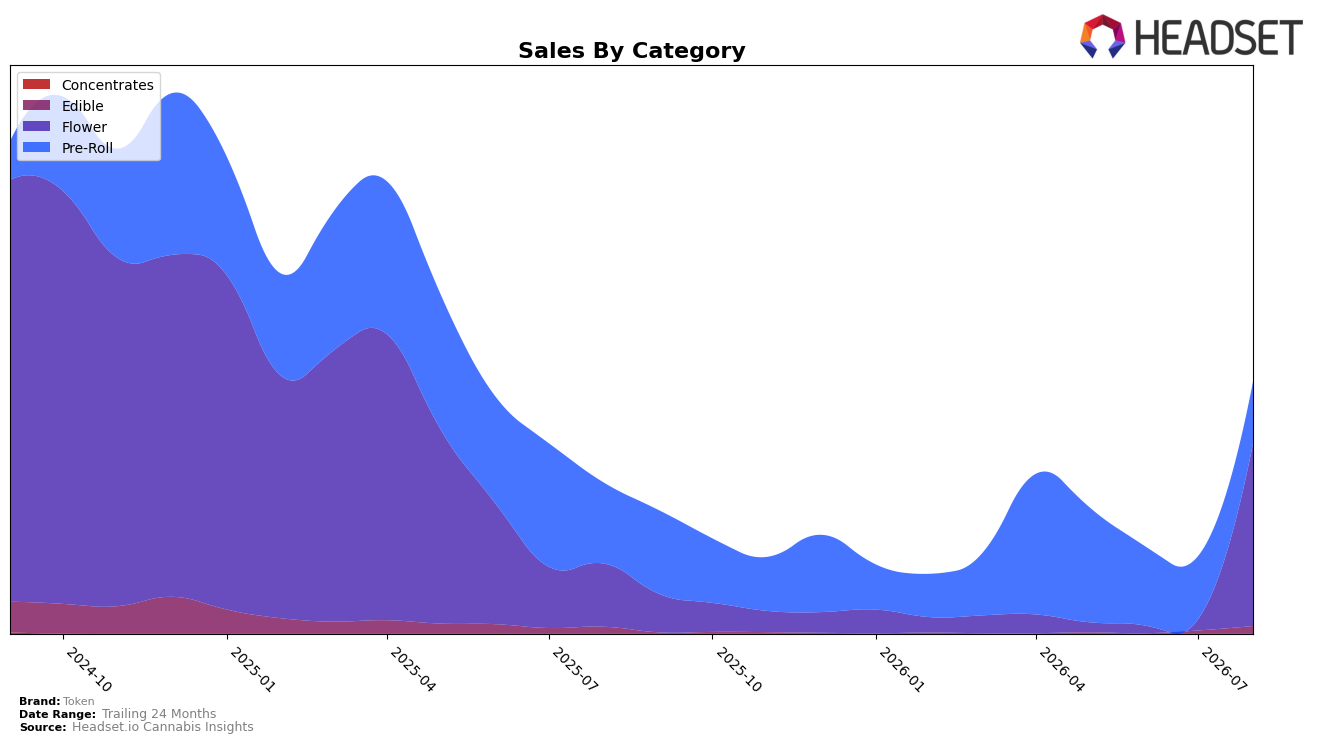
Token’s category mix in August 2026 concentrates in Flower at 72.66% share, up 191.05% year over year and 1,603.50% month over month, while Pre-Roll holds 24.40% share with a -23.87% YoY decline and a -2.35% MoM dip. Edible remains a small 2.95% share but jumped 11.58% YoY and 155.08% MoM, indicating a fast-recovering niche. The average price across the brand rose 115.98% YoY to $36.69, while Flower’s category-level price point sits higher at an average of $101.25, suggesting a trade-up effect aligned with the category pivot. In Alberta Flower, Token sits at rank 60, placing the Flower surge within a lower-tier competitive bracket; the mix shift implies a deliberate move to scale Flower despite a 60th-place baseline and to offset Pre-Roll contraction with higher-priced units.
The movement toward a 72.66% Flower share alongside a 191.05% YoY and 1,603.50% MoM Flower surge, paired with a -23.87% YoY drag in Pre-Roll and a 155.08% MoM pop in Edible, implies Token is trading depth for breadth: leaning into premium-priced Flower to drive contribution while using Edible as a volatility buffer. The 115.98% YoY jump in average price, contrasted with a 24.40% mix in a declining Pre-Roll segment and a 2.95% yet accelerating Edible slice, points to a positioning centered on higher ticket sizes rather than unit-led volume, with the rank 60 standing in Alberta Flower indicating headroom for distribution or SKU optimization to convert pricing power into share.
Competitive Landscape
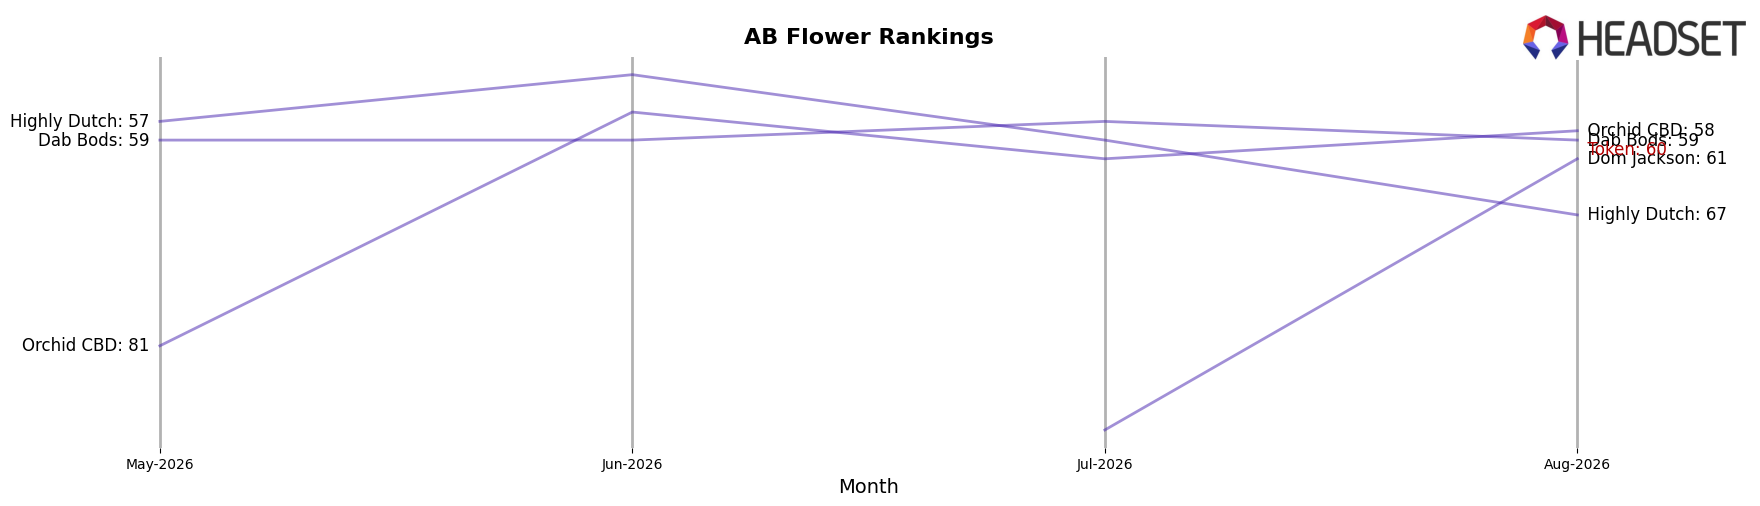
Token sits at #60 in AB Flower in August 2026, a 87-place climb from #147 year over year, while its historical peak was #41 in September 2024; that trajectory contrasts with FIGR moving to #1 with 182.4% YoY sales growth and Spinach holding #2 with 17.5% YoY growth, as Back Forty / Back 40 Cannabis sits at #3 despite an 8.3% YoY sales decline. The 87-rank YoY improvement alongside a current #60 position and a prior peak at #41 signals a recovery path that has regained placement but not yet recaptured its September 2024 ceiling, implying near-term share gains are plausible if momentum against top-5 incumbents persists.
Notable Products
Dark Mint Delight Chocolate (10mg) posted the largest movement in August 2026 with a +348% month-over-month jump to rank 3, while Safari Splash Kief Coated Infused Blunt (1g) fell -56% to rank 8. OG Quad Pack Pre-Roll 4-Pack (2g) rose +22.6% to hold rank 1, and Creamy Hazelnut Chocolate (10mg) climbed +151% to rank 4. Two Edible SKUs landed in the top five alongside a stabilizing Pre-Roll leader, implying Token’s near-term mix is tilting toward Edibles for incremental volume while Pre-Rolls anchor visibility.
Top Selling Cannabis Brands






Data for this report comes from real-time sales reporting by participating cannabis retailers via their point-of-sale systems, which are linked up with Headset’s business intelligence software. Headset’s data is very reliable, as it comes digitally direct from our partner retailers. However, the potential does exist for misreporting in the instance of duplicates, incorrectly classified products, inaccurate entry of products into point-of-sale systems, or even simple human error at the point of purchase. Thus, there is a slight margin of error to consider. Brands listed on this page are ranked in the top twenty within the market and product category by total retail sales volume.

