.svg)

Aug-2026
Sales
Trend
6-Month
Product Count
SKUs
Avg Price
YoY Sales Change
YoY Price Change


Where to Buy
Trail Blazin Productions is stocked at 29 licensed dispensaries across Washington, with the deepest coverage in Bellingham, Seattle, Ellensburg, Everett, and Tacoma. Search by ZIP code or city below to find the closest one, or filter by product type if you are after a specific format.
Market Insights Snapshot
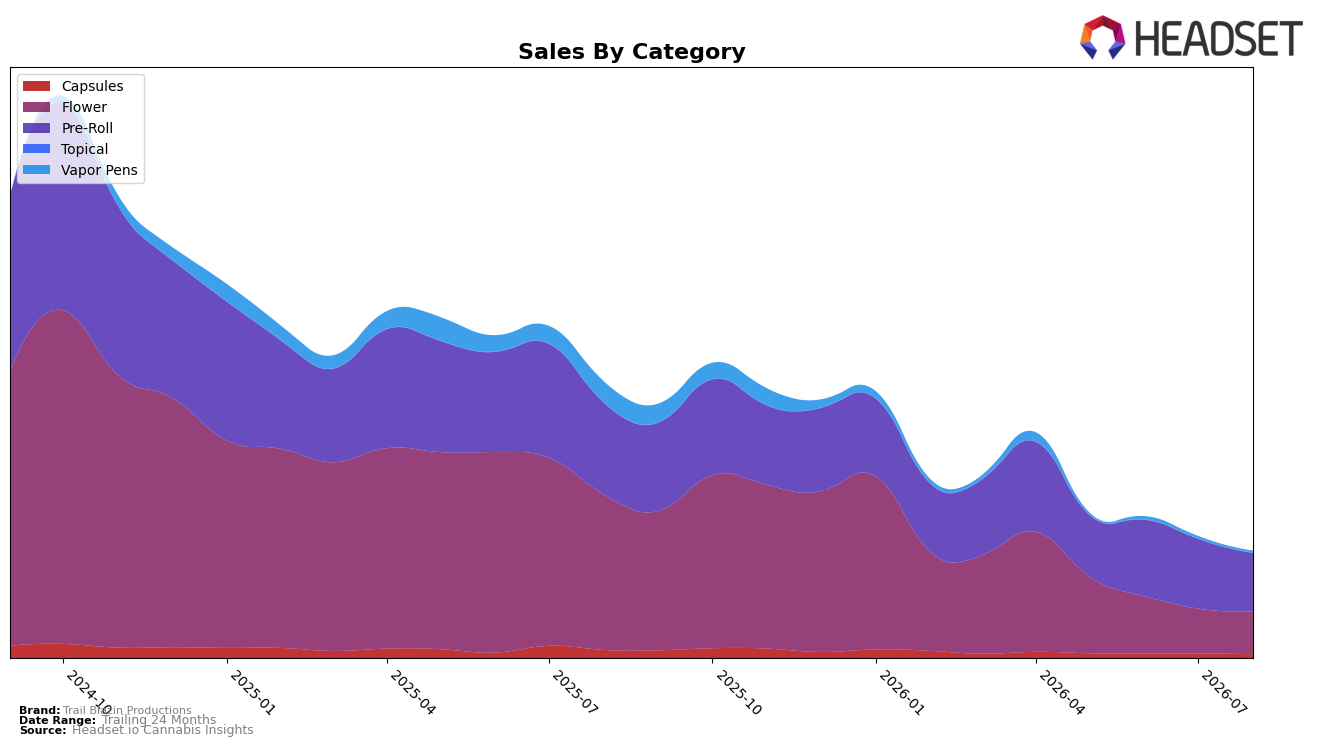
In August 2026, Trail Blazin Productions concentrated 54.72% of sales in Pre-Roll, with Flower at 40.16%, indicating a tilt toward value-led formats as Pre-Roll average price sat at $12.55 while Flower averaged $27.15. Year over year, Pre-Roll declined 36.56% and Flower fell 72.49%, while month over month Pre-Roll dropped 16.46% and Flower contracted 4.23%, implying that the steep YoY erosion is concentrated in Flower while near-term pressure is heavier in Pre-Roll. Capsules held 3.55% share with a 53.31% YoY decline and a 17.23% MoM dip, and Vapor Pens remained marginal at 1.57% share with a 91.93% YoY fall and a 27.65% MoM slide; together these minor categories contribute little stabilizing volume. The pattern implies the brand is consolidating around Pre-Roll to preserve share while de-emphasizing higher-price and peripheral formats as overall brand sales fell 61.46% YoY and average price decreased 8.42% YoY.
The shift toward a 54.72% Pre-Roll mix alongside a 40.16% Flower share, combined with an 8.42% YoY average price decline and a 16.46% MoM dip in Pre-Roll, suggests a price-sensitive customer base that is trading down within the portfolio. With Vapor Pens contracting 27.65% MoM and 91.93% YoY and Capsules sliding 17.23% MoM and 53.31% YoY, the brand’s narrower category footprint increases exposure to Pre-Roll volatility and limits cross-category insulation. Given Washington rank data for Pre-Roll is unavailable and state concentration centers on Washington, sustaining relevance likely depends on defending Pre-Roll velocity while selectively pruning unprofitable SKUs in Flower where YoY decline reached 72.49% and reinforcing entry-price ladders where MoM softness is most acute.
Competitive Landscape
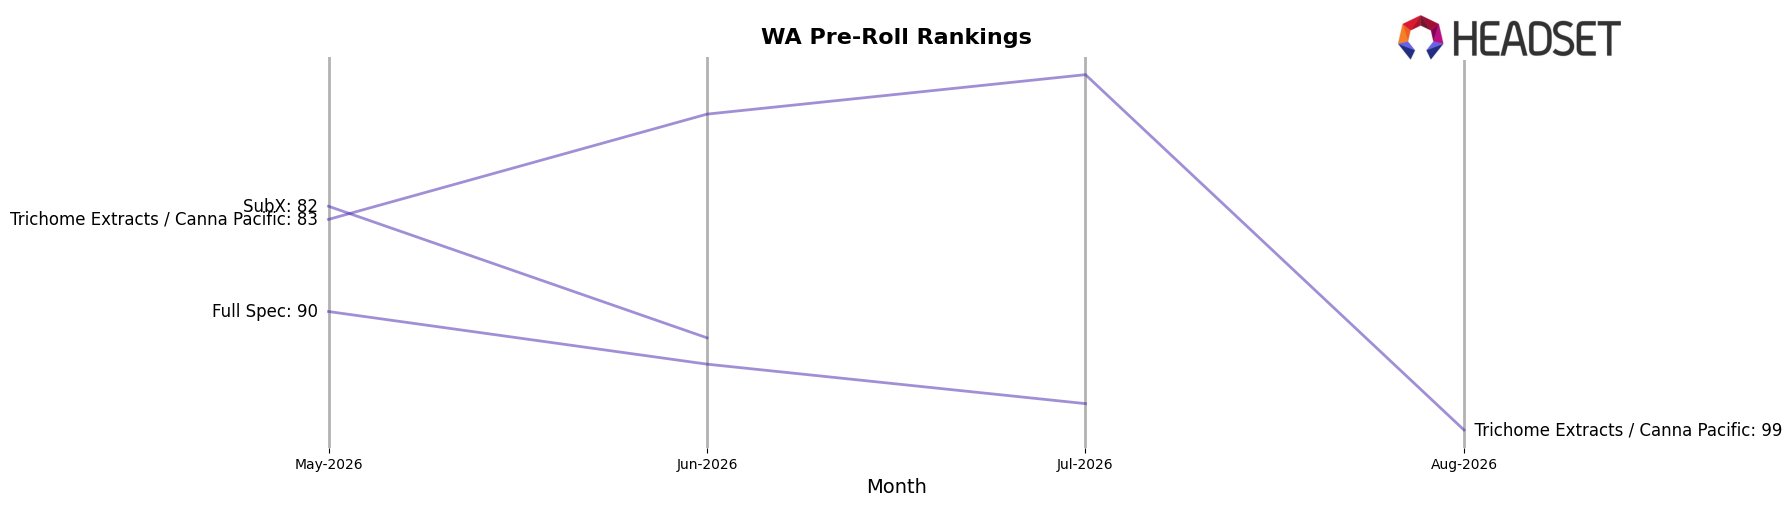
Trail Blazin Productions sits at rank #125 in WA Pre-Roll for August 2026, down 17 positions YoY from #108 and 4 positions from May 2026’s #121, while still far from its peak at #55 in August 2024; in contrast, Ooowee holds #1 with a 53.1% YoY sales increase and Lifted Cannabis Co improved from #6 to #4 alongside a 28.8% YoY gain. With Phat Panda stable at #2 on 7.9% YoY growth and Fire Bros. rising from #9 to #5 on 35.7% YoY growth, the brand’s slide from #108 to #125 and from #121 to #125 implies erosion in relative shelf presence and a widening competitive gap that will be hard to close without a change in velocity mix.
Notable Products
Harlequin Pre-Roll 2-Pack (1.2g) posted the standout surge in August 2026 with +125.4% MoM to rank 1, while Amnesia Pre-Roll 2-Pack (1.2g) also jumped +92.9% to rank 4, implying a pivot toward value-sized pre-roll formats leading the leaderboard. Northern Lights #5 Preroll 2-Pack (1.2g) slid -5.4% MoM at rank 2 as Northern Lights Pre-Roll 2-Pack (1.2g) in rank 6 inched up +2.6%, indicating share is consolidating toward SKUs with sharper growth rather than legacy variants. With eight of the top ten in Pre-Roll and only two Flower SKUs—Harlequin (3.5g) at rank 5 with +35.7% and 9# Hammer (3.5g) at rank 9—dollar velocity is centering on pre-rolls even as a single Flower anchor still contributes $2,338. The pattern implies Trail Blazin Productions is tilting its commercial mix toward fast-turn pre-roll multipacks while keeping a limited Flower presence as a stabilizer.
Top Selling Cannabis Brands






Data for this report comes from real-time sales reporting by participating cannabis retailers via their point-of-sale systems, which are linked up with Headset’s business intelligence software. Headset’s data is very reliable, as it comes digitally direct from our partner retailers. However, the potential does exist for misreporting in the instance of duplicates, incorrectly classified products, inaccurate entry of products into point-of-sale systems, or even simple human error at the point of purchase. Thus, there is a slight margin of error to consider. Brands listed on this page are ranked in the top twenty within the market and product category by total retail sales volume.

