.svg)

Sep-2026
Sales
Trend
6-Month
Product Count
SKUs
Avg Price
YoY Sales Change
YoY Price Change


Where to Buy
Buddy Boy Farms is stocked at 76 licensed dispensaries across Washington, with the deepest coverage in Spokane, Seattle, Spokane Valley, Vancouver, and Everett. Search by ZIP code or city below to find the closest one, or filter by product type if you are after a specific format.
Market Insights Snapshot
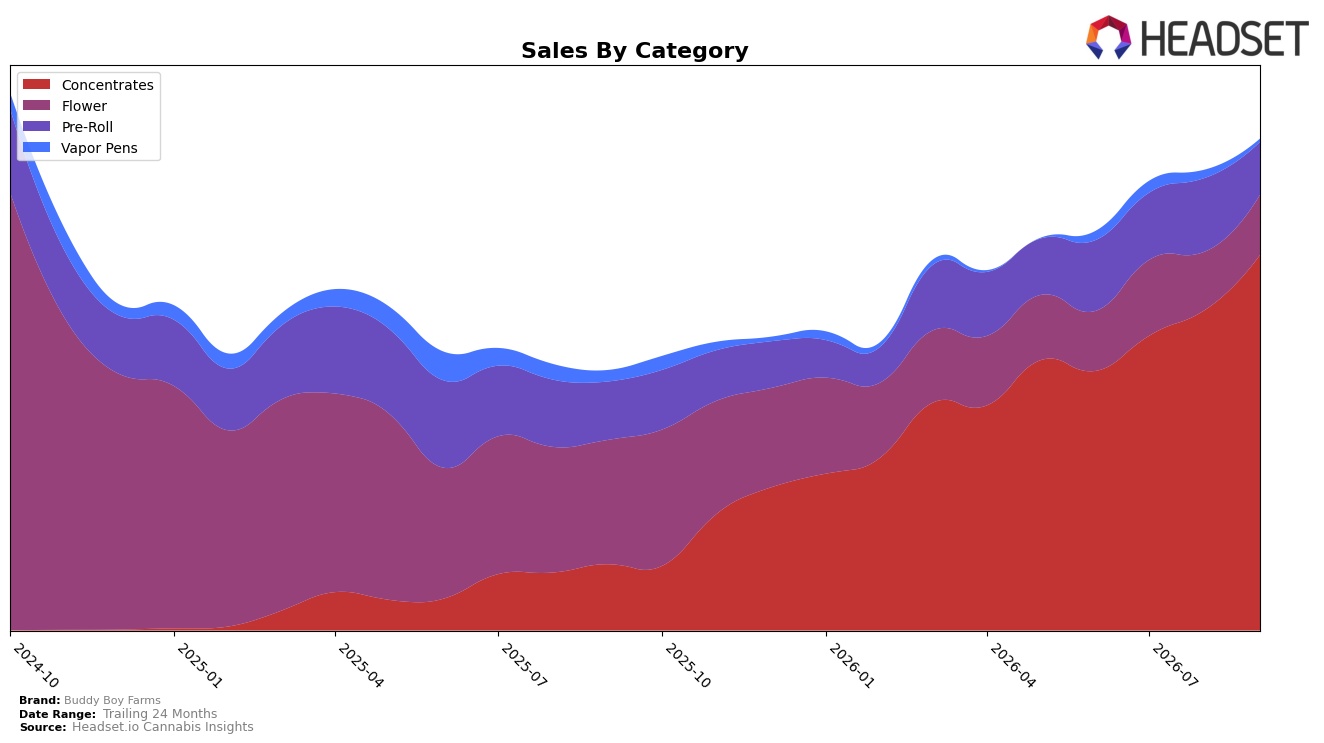
In September 2026, Buddy Boy Farms concentrated its revenue in Concentrates at 76.22% share, up 17.19% month over month and 464.53% year over year, while Flower held 12.28% share with a 2.95% MoM uptick but a 51.45% YoY drop; meanwhile, Pre-Roll accounted for 10.78% share with a 28.15% MoM contraction and 9.48% YoY decline. Vapor Pens slipped to 0.73% share with a 58.23% MoM decrease and 69.44% YoY fall, even as the brand’s average price decreased 10.42% YoY alongside overall brand sales up 88.40% YoY. The pattern implies a decisive pivot toward Concentrates as the growth engine, with modest stabilization in Flower, and a retreat from Pre-Roll and Vapor Pens that concentrates the portfolio around a single high-momentum category.
That mix shift positions Buddy Boy Farms as a Concentrates-led player in Washington, where a rank of 4 in Concentrates coincides with a 17.19% MoM category gain and a 464.53% YoY surge, suggesting pricing flexibility (10.42% YoY price decrease at the brand level) is being used to scale volume in its core lane. With Pre-Roll down 28.15% MoM and Vapor Pens down 58.23% MoM, the portfolio is narrowing, which can elevate focus and rank resilience in Concentrates but increases dependency risk; the thesis is that maintaining a top-5 Concentrates position while selectively rehabilitating Flower (2.95% MoM growth despite a 51.45% YoY decline) will balance growth momentum with category diversification.
Competitive Landscape
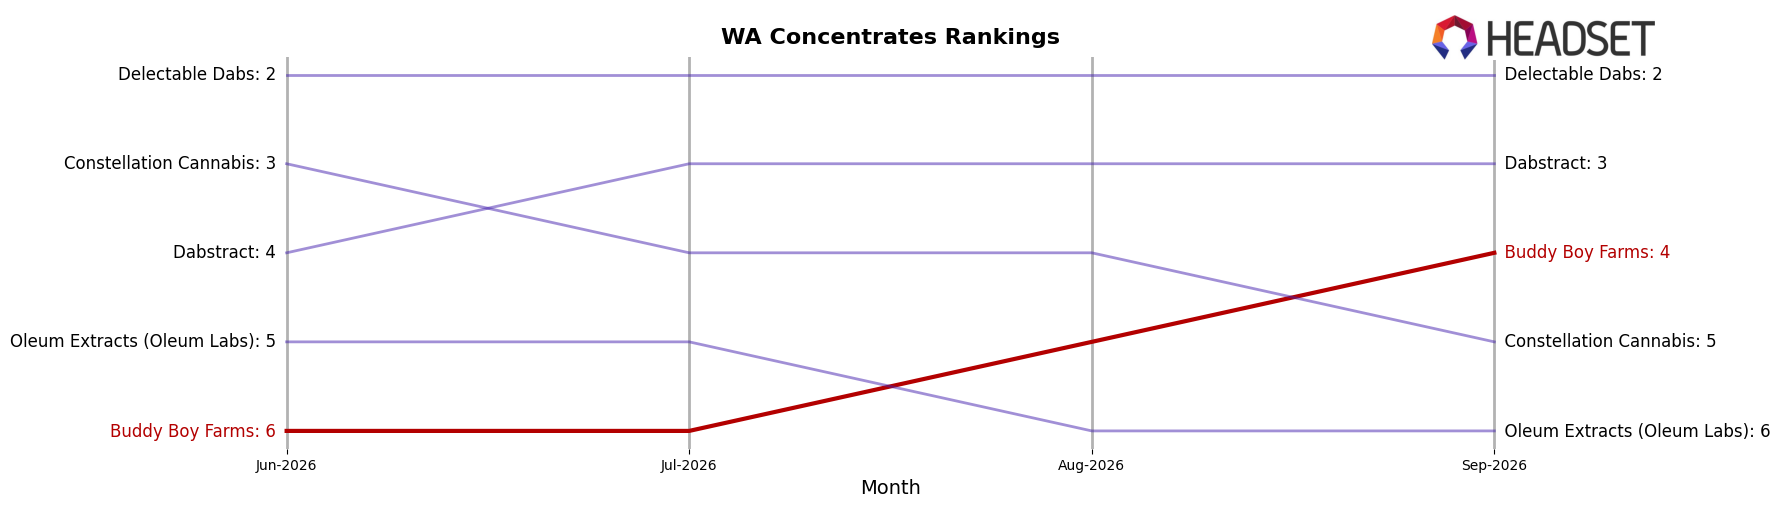
Buddy Boy Farms sits at rank #4 in WA Concentrates in September 2026 after climbing 45 spots year over year from #49, and improving 2 positions from #6 in June 2026 to its peak at #4 in September 2026; by contrast, Ooowee held #1 both year over year and currently while posting a -7.8% sales change, and Dabstract is at #3 with a +11.8% sales change yet did not gain rank versus its #3 a year ago. The three-month rise from #6 to #4 coincides with overtaking Constellation Cannabis, which moved from #11 a year ago to #5 now alongside an +88.8% sales lift, indicating Buddy Boy Farms is advancing faster in rank velocity than peers that either maintained position (e.g., #1 and #3) or surged in sales but remain below #4. This rank trajectory implies Buddy Boy Farms is converting distribution or mix into share gains faster than competitors, positioning it to contest the #3 spot next if the 2-position climb over the last three months persists.
Notable Products
Rainbow Guava #5 Full Spectrum Rosin (1g) posted the steepest decline at -31.18% and sits at rank 7, while Swampwater Fumez Full Spectrum Hash Rosin (1g) dipped -8.11% yet holds rank 1. GMO Hash Rosin (1g) surged 41.78% to rank 3, and Peach Guava Rosin (1g) climbed 41.19% at rank 9, signaling momentum concentrated below the top spot. The top ten are entirely Concentrates, and four SKUs in the top five posted double-digit gains between 19.59% and 41.78%, implying a tilt toward solventless rosin depth even as the lead SKU softens.
Top Selling Cannabis Brands






Data for this report comes from real-time sales reporting by participating cannabis retailers via their point-of-sale systems, which are linked up with Headset’s business intelligence software. Headset’s data is very reliable, as it comes digitally direct from our partner retailers. However, the potential does exist for misreporting in the instance of duplicates, incorrectly classified products, inaccurate entry of products into point-of-sale systems, or even simple human error at the point of purchase. Thus, there is a slight margin of error to consider. Brands listed on this page are ranked in the top twenty within the market and product category by total retail sales volume.

