Jun-2026
Sales
Trend
6-Month
Product Count
SKUs
Avg Price
YoY Sales Change
YoY Price Change
Market Insights Snapshot
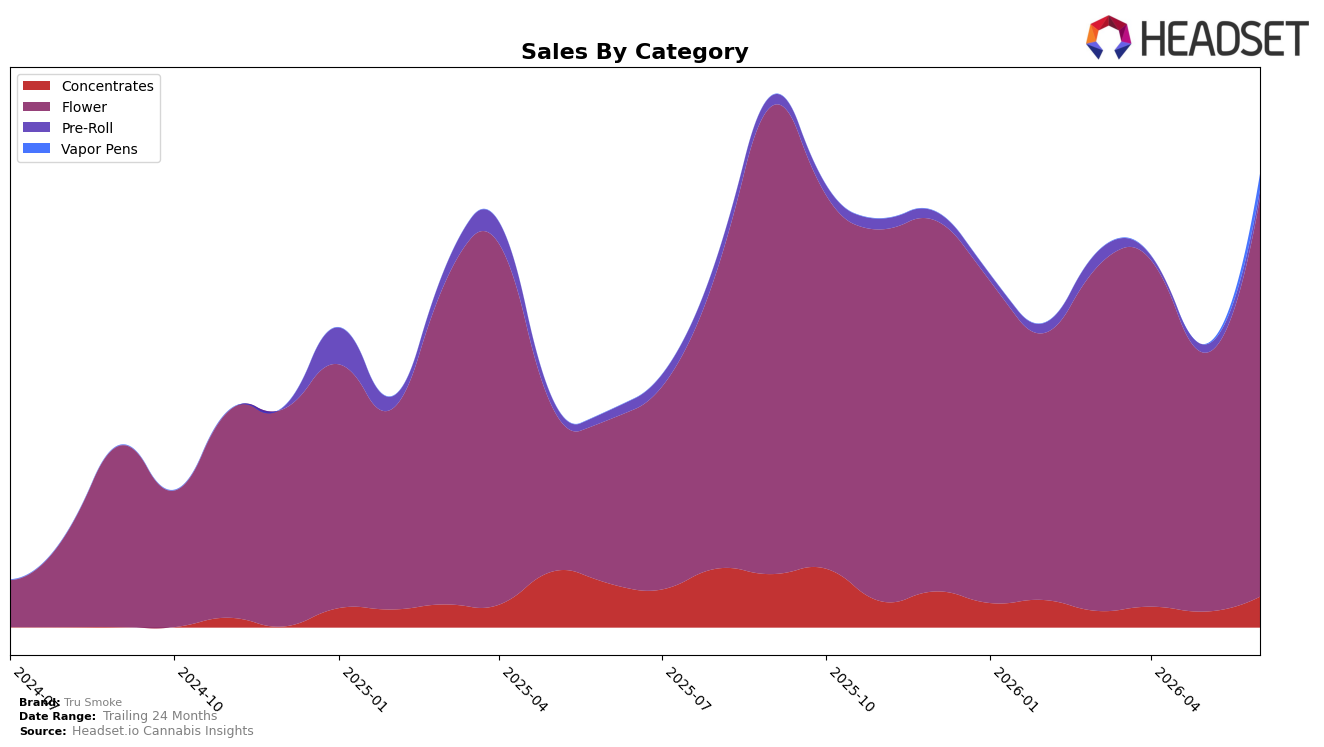
In June 2026, Tru Smoke concentrated 88.10% of sales in Flower, up with category sales growing 144.58% year over year and 54.14% month over month, while the brand’s overall sales rose 109.87% YoY and average price fell 76.49% YoY to $7.79. Concentrates held 6.74% share with a 95.28% MoM lift but a -30.62% YoY decline, and Pre-Roll sat at 1.67% share with -12.54% YoY and -3.10% MoM, as Vapor Pens contributed 3.48% share with no reported YoY or MoM data. With Flower ranked 22 in Michigan and carrying an average price of $7.18, the mix skews toward high-velocity, lower-price Flower that is expanding share faster MoM than smaller formats are recovering, implying Tru Smoke is riding volume-led gains while secondary categories either lag or are tactically deprioritized.
The pattern implies Tru Smoke’s positioning is anchored to value-forward Flower in Michigan, where a rank of 22 suggests mid-pack scale that benefits more from 54.14% MoM momentum than from breadth across categories with shrinking or flat trajectories. The 95.28% MoM spike in Concentrates alongside a -30.62% YoY gap points to promotion- or pricing-led reactivation rather than durable mix expansion, whereas Pre-Roll’s -3.10% MoM and -12.54% YoY indicate resource pullback; combined with a 76.49% YoY price drop, the brand is trading margin for share in Flower to move up the rank order, and the sustainability of gains depends on converting the June 2026 MoM surges into repeatable velocity without further mix concentration risk.
Competitive Landscape
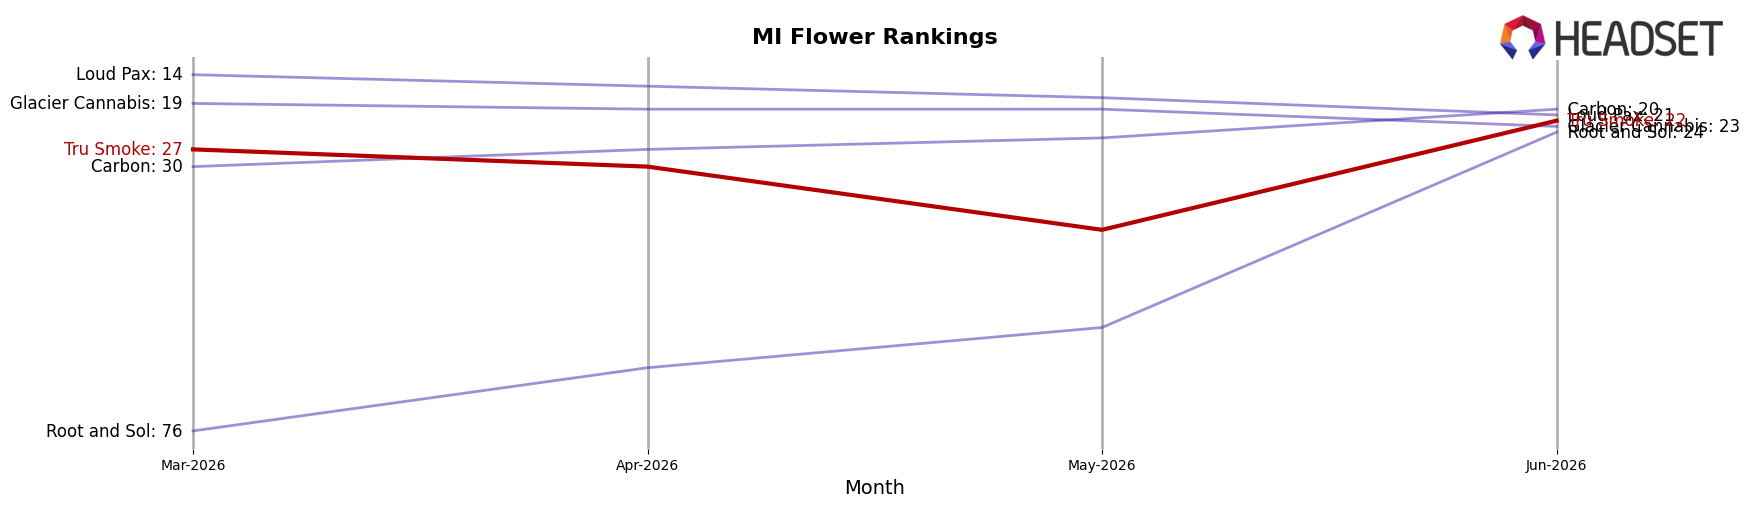
Tru Smoke is ranked #22 in MI Flower in June 2026, improving 43 positions year over year from #65, while slipping 5 spots from #27 in March 2026 and sitting below its peak of #14 from September 2025; in contrast, High Minded held #1 year over year despite a 13.73% decline in sales, and Goodlyfe Farms advanced from #5 to #2 with 44.07% sales growth, indicating Tru Smoke’s climb is driven more by rank churn than category-wide expansion and implying a path where maintaining recent share gains requires converting mid-tier volatility into sustained top-20 presence.
Notable Products
Stink (Bulk) delivered the clearest movement in June 2026 with a 284.37% month-over-month surge to $86,764 while jumping to rank 1, outpacing Detroit Shuffle (Bulk) at rank 4 with a 73.74% gain and White Iverson (Bulk) at rank 3 with a 51.63% rise. Baby Diablo (Bulk) also accelerated 132.01% to support mid-pack depth as White Iverson Smalls (Bulk) and Pie Scream Smalls (Bulk) spiked 259.37% and 229.50% respectively into the back half of the top 10, indicating momentum is not confined to a single flagship. With all top-10 entries in the Flower category and multiple Smalls variants entering at ranks 9 and 10, the mix skews toward breadth within one category and pack sizes that can scale quickly. The pattern implies Tru Smoke is consolidating share through Flower-led velocity with Smalls acting as on-ramps, pointing to a pricing and format strategy that leans into rapid trial and laddering up to premium bulk.
Top Selling Cannabis Brands
Data for this report comes from real-time sales reporting by participating cannabis retailers via their point-of-sale systems, which are linked up with Headset’s business intelligence software. Headset’s data is very reliable, as it comes digitally direct from our partner retailers. However, the potential does exist for misreporting in the instance of duplicates, incorrectly classified products, inaccurate entry of products into point-of-sale systems, or even simple human error at the point of purchase. Thus, there is a slight margin of error to consider. Brands listed on this page are ranked in the top twenty within the market and product category by total retail sales volume.

