Market Insights Snapshot
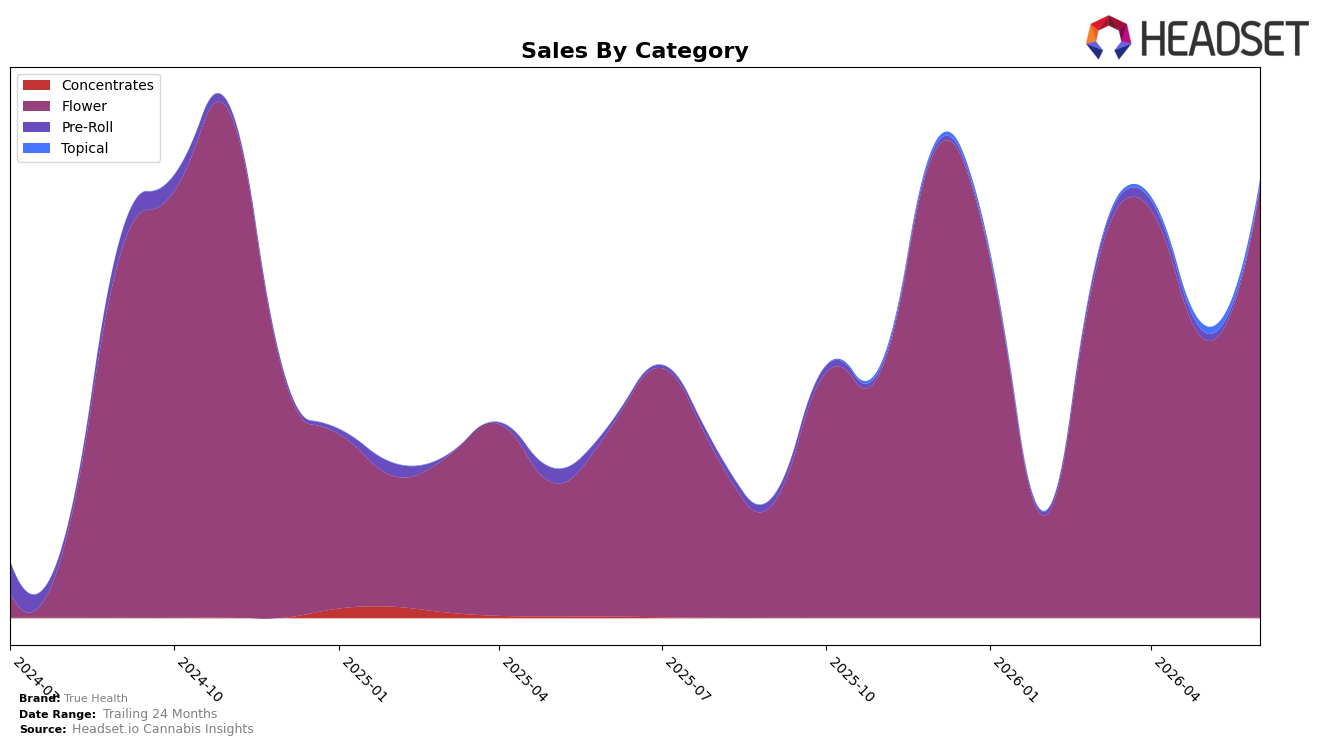
In June 2026, True Health concentrated 98.17% of sales in Flower with year-over-year growth of 132.42% and month-over-month growth of 54.39%, while Topical held 1.36% share with a -9.78% month-over-month change and Pre-Roll accounted for 0.47% share with a -70.33% month-over-month decline. The brand’s overall year-over-year sales grew 129.19% alongside a 7.37% year-over-year increase in average price to $21.42, and the Flower average price sat at $21.92, indicating volume gains beyond price lift. This combination of a surging Flower base and contracting Pre-Roll mix implies a deliberate focus on a single high-velocity segment that trades off diversification for scale efficiency.
Within Flower in Michigan, True Health ranked 78th, despite Flower commanding 98.17% of its portfolio and growing 54.39% month-over-month, while Topical’s -9.78% month-over-month and Pre-Roll’s -70.33% month-over-month moves trimmed cross-category reach. The 7.37% average price increase alongside a 132.42% year-over-year Flower lift suggests the brand is leaning into higher-throughput SKUs rather than broadening formats, and the shrinking Pre-Roll share of 0.47% signals reduced trial or bundling opportunities. Taken together, June 2026 positioning favors deep penetration in Flower over balanced category coverage, which implies near-term share capture potential inside a single aisle but limited insulation if Flower growth normalizes.
Competitive Landscape
True Health sits at rank #78 in Michigan Flower for June 2026, a 88-place climb from #166 year over year and a 25-spot rise from #103 three months ago; this new peak rank of #78 in June 2026 contrasts with Goodlyfe Farms advancing from #5 to #2 alongside a 44.1% YoY sales increase, while category leader High Minded held #1 but with a -13.7% YoY sales change. Against the top tier, Society C edged up from #2 to #3 with an 18.4% YoY sales lift and Mischief jumped from #13 to #5 on 146.1% YoY growth, indicating True Health’s rank recovery is driven by momentum off a low base rather than category-wide contraction, implying the trajectory points to mid-tier viability if distribution and velocity gains sustain into the next quarter.

Notable Products
Scented Marker (Bulk) posted the largest movement in June 2026 with a 407.1% month-over-month surge to $46,544 and reached rank 4, while Designer Runtz (Bulk) jumped 189.0% to rank 3. Sweet Sorbet (Bulk) also climbed 84.8% to secure rank 1, outpacing the 56.5% gain of P41 (Bulk) at rank 6. With eight of the top ten being Flower SKUs and only two Pre-Roll entries stuck at ranks 7 and 10 with +25.5% and -97.7% respectively, the lineup is consolidating around bulk Flower velocity rather than ready-to-use formats.
The steepest decline came from Gary Satan Pre-Roll (1g) at -97.7% in rank 10, contrasting with Western Runtz (Bulk) up 62.2% at rank 5. Red Panda #2 (Bulk) fell 78.9% yet Flower still holds ranks 1 through 6, indicating category share is being reallocated within Flower rather than ceded to other forms. The pattern implies True Health is concentrating demand in a few accelerating bulk Flower leaders, positioning the portfolio toward high-volume strains over breadth in Pre-Rolls or Topicals.
Top Selling Cannabis Brands
Data for this report comes from real-time sales reporting by participating cannabis retailers via their point-of-sale systems, which are linked up with Headset’s business intelligence software. Headset’s data is very reliable, as it comes digitally direct from our partner retailers. However, the potential does exist for misreporting in the instance of duplicates, incorrectly classified products, inaccurate entry of products into point-of-sale systems, or even simple human error at the point of purchase. Thus, there is a slight margin of error to consider. Brands listed on this page are ranked in the top twenty within the market and product category by total retail sales volume.

