.svg)

Sep-2026
Sales
Trend
6-Month
Product Count
SKUs
Avg Price
YoY Sales Change
YoY Price Change


Market Insights Snapshot
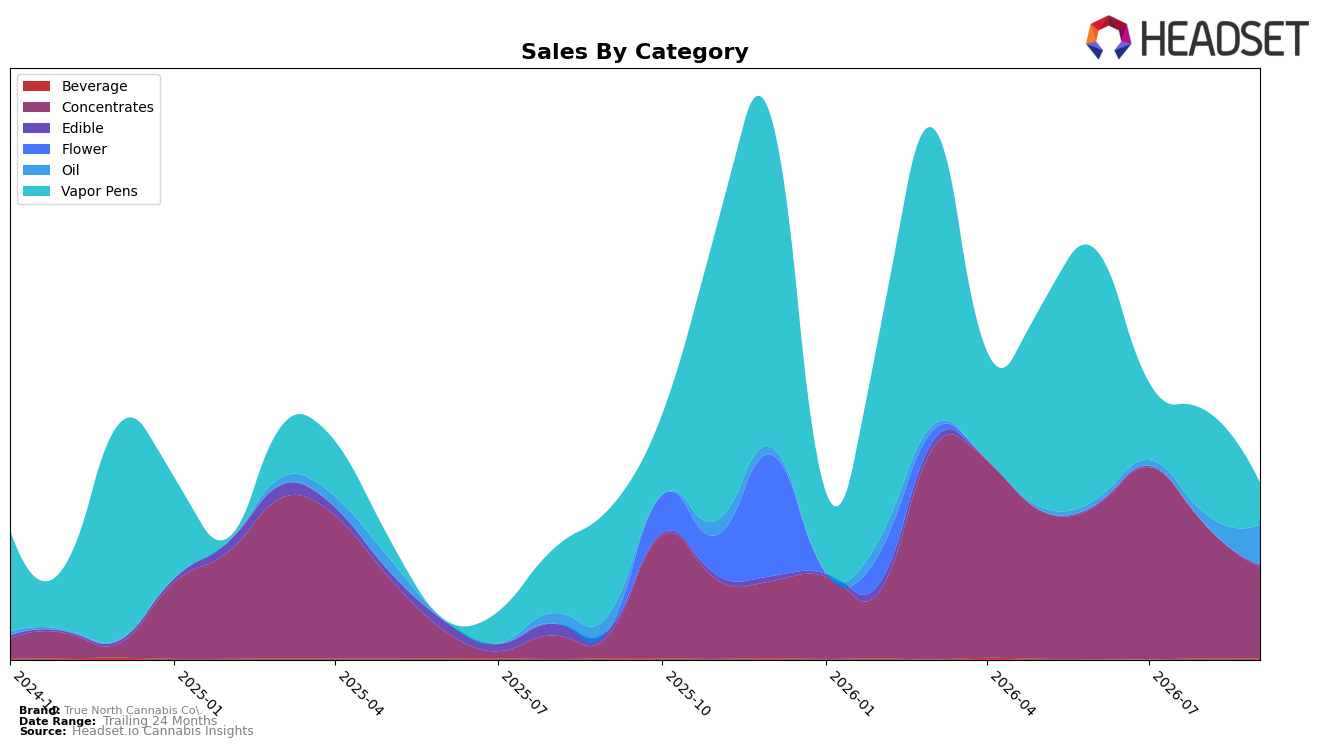
In September 2026, True North Cannabis Co. concentrated its mix around Concentrates at 52.28% share with 304.34% YoY growth and a -31.43% MoM decline, while Oil climbed to 22.50% share with 175.27% YoY growth and a 280.48% MoM surge; by contrast, Vapor Pens fell to 23.97% share with -59.90% YoY and -59.05% MoM. Edible contracted to 0.82% share with -71.49% YoY and unavailable MoM, and Beverage slipped to 0.43% share with -32.03% YoY and -31.40% MoM. With brand-level sales up 18.51% YoY and the average price up 33.62%, the pattern implies a pivot from Vapor Pens into higher-velocity Concentrates and newly resurgent Oil, trading volume volatility for margin via mix and pricing.
The shift places True North Cannabis Co. to compete on potency-led use cases rather than convenience formats, as a 280.48% MoM spike in Oil alongside a -31.43% MoM cooldown in Concentrates splits short-cycle trial from sustained attach rates, while a -59.05% MoM drop in Vapor Pens and -32.03% YoY in Beverage reduce exposure to discount-sensitive segments. With Concentrates holding the top category share at 52.28% and Oil advancing to 22.50%, and with Saskatchewan as the leading province, the implication is that September 2026 positioning leans into potency and price elasticity to support the 18.51% YoY brand growth even as certain convenience and novelty segments retrench.
Competitive Landscape
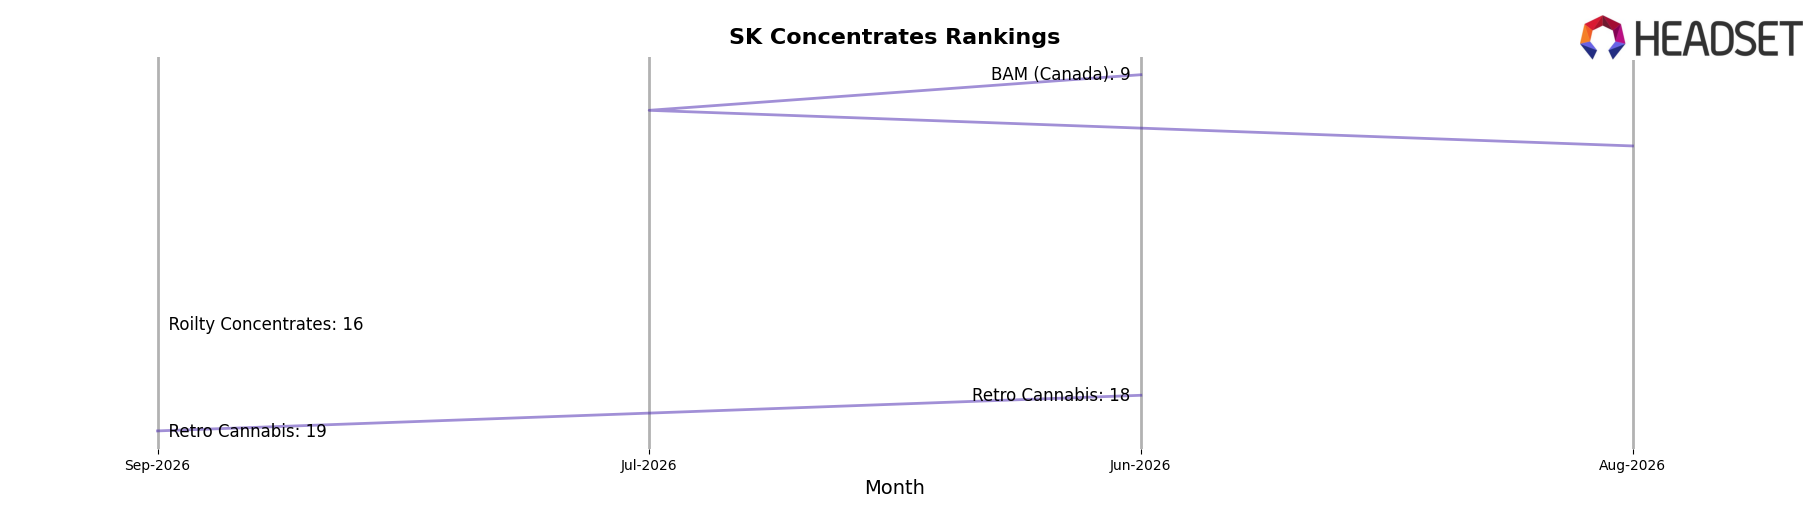
True North Cannabis Co. sits at rank 29 in SK Concentrates in September 2026, down 3 positions from rank 26 in June 2026, with no year-over-year rank reported, and still well off its category peak of rank 13 from March 2026. In contrast, BoxHot rose 23 ranks year over year to rank 4 while expanding sales by 527.6%, and 7 Acres moved up 13 ranks to rank 2 with 372.3% sales growth, indicating that category gains are concentrating among faster-moving rivals as True North Cannabis Co. cedes rank share. The combination of a 3-position slide over three months alongside competitor rank ascents of 23 and 13 suggests that without a product or pricing reset, the brand’s trajectory points toward further mid-pack erosion rather than a return to its March 2026 peak.
Notable Products
CBD Nectar N-1K Hemp Oil (30ml) posted the largest swing with a 280% month-over-month gain to rank 1, while Sour Widow Shatter (1g) fell 54% month over month to rank 2. Jealous Fruit Nug Run Sugar Sauce (1g) also surged 173% to tie at rank 4, and Rainbow Ride Cured Badder (1g) dropped 71% while sliding to rank 7. With five of the top ten coming from Concentrates and showing both triple-digit gains and steep double-digit declines in the same month, the pattern implies a pivot to volatile, promotion-sensitive extracts anchored by a stabilized Oil leader.
Top Selling Cannabis Brands






Data for this report comes from real-time sales reporting by participating cannabis retailers via their point-of-sale systems, which are linked up with Headset’s business intelligence software. Headset’s data is very reliable, as it comes digitally direct from our partner retailers. However, the potential does exist for misreporting in the instance of duplicates, incorrectly classified products, inaccurate entry of products into point-of-sale systems, or even simple human error at the point of purchase. Thus, there is a slight margin of error to consider. Brands listed on this page are ranked in the top twenty within the market and product category by total retail sales volume.

