Jun-2026
Sales
Trend
6-Month
Product Count
SKUs
Avg Price
YoY Sales Change
YoY Price Change
Market Insights Snapshot
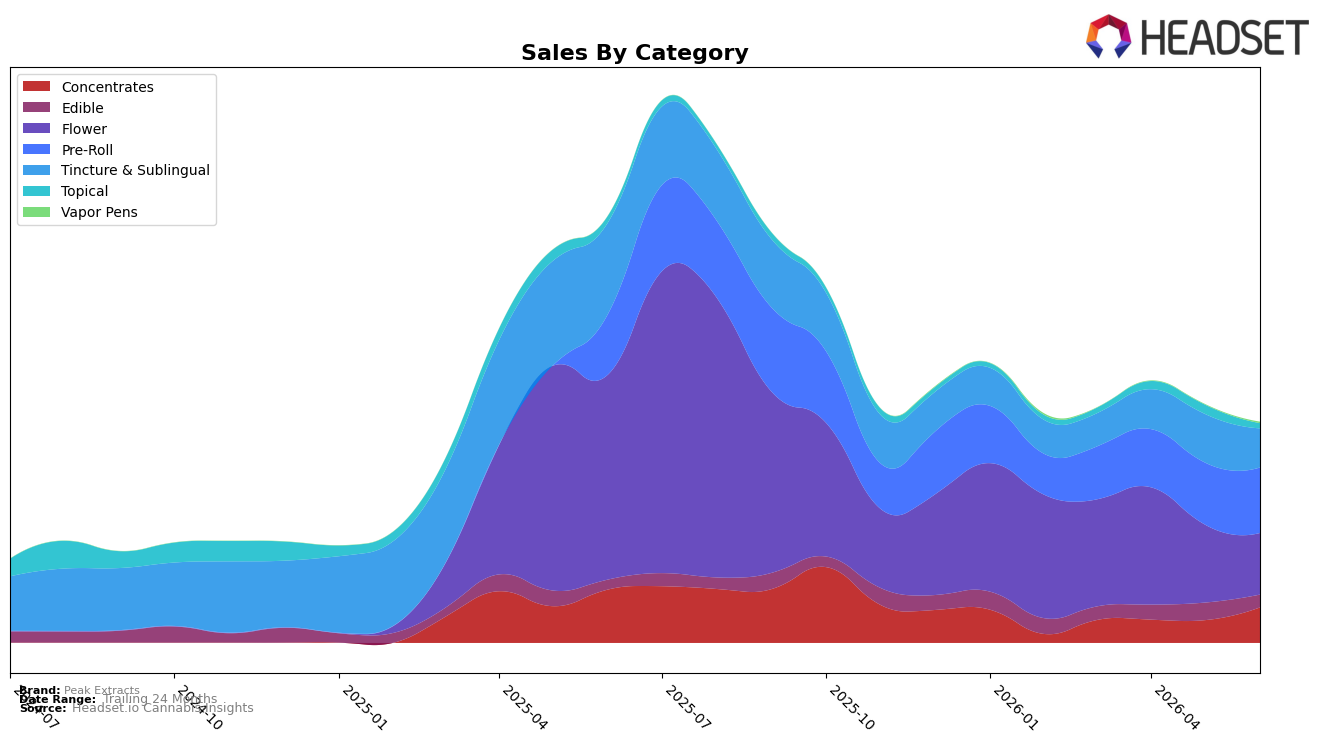
In June 2026, Peak Extracts concentrated revenue into Pre-Roll at 29.76% share with year-over-year growth of 7.72% and month-over-month growth of 5.65%, while Flower slipped to 27.96% share with a 70.08% YoY decline and a 21.27% MoM drop. Concentrates expanded to 16.08% share on a 56.88% MoM surge despite a 33.67% YoY decline, and Tincture & Sublingual held 17.69% share with a 57.44% YoY contraction and 19.68% MoM decline. Edible remained a minor contributor at 5.71% share with a 29.21% YoY increase but a 27.61% MoM fall, while Topical at 2.24% share declined 24.76% YoY and 45.57% MoM; Vapor Pens, though just 0.56% share, spiked 214.11% MoM. The mix implies Peak Extracts is pivoting away from historically larger but shrinking Flower and Tincture & Sublingual toward Pre-Roll and Concentrates, with June 2026 momentum concentrated in faster-turn segments despite an overall brand sales YoY decline of 48.53%.
Positioning-wise, the 7.72% YoY lift in Pre-Roll and 56.88% MoM acceleration in Concentrates suggest an emphasis on inhalable formats at mid-to-higher average prices ($36.73 Pre-Roll vs. $28.53 Concentrates), while the 15.01% YoY drop in overall average price signals tactical price realignment to retain volume in weak categories posting 70.08% YoY decline (Flower) and 57.44% YoY decline (Tincture & Sublingual). With a 5.71% share in Edible showing 29.21% YoY growth but 27.61% MoM pullback, and Vapor Pens up 214.11% MoM off a 0.56% base, the pattern implies Peak Extracts is consolidating around Pre-Roll leadership where it ranks 53rd in Missouri while testing a secondary bet on Concentrates to stabilize mix against volatility in non-inhalable formats.
Competitive Landscape
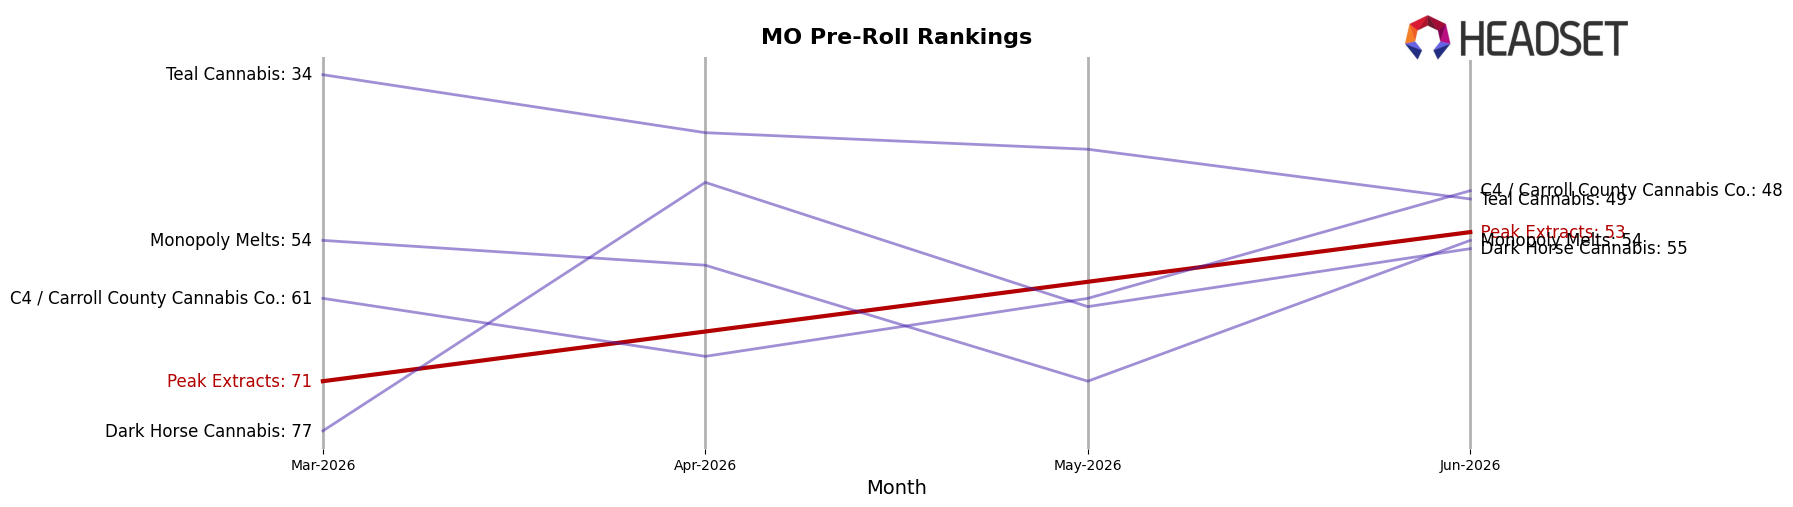
Peak Extracts sits at rank #53 in MO Pre-Roll in June 2026, improving 10 positions from #63 year over year, and climbing 18 spots from #71 three months ago; this marks a new peak rank of #53 in June 2026 while the category leaders remain entrenched at the top. In contrast, Jeeter holds at #1 while Sinse Cannabis advanced from #7 to #3 alongside a 177.97% YoY sales lift, and Good Day Farm slipped from #1 to #4 with a 39.54% YoY sales decline; meanwhile, Illicit / Illicit Gardens stayed at #2 with a 44.61% YoY sales increase. The pattern implies Peak Extracts’ rank trajectory is a late-cycle mover—gaining share off a low base—while the top tier reshuffles around it, signaling room for targeted plays against incumbents as upward momentum consolidates from March 2026 to June 2026.
Notable Products
Mini Dark Chocolate Bar (100mg) posted the steepest decline at -43.7% MoM, while Buff Cherry (3.5g) also fell -33.0% to rank 1, and Buff Cherry Pre-Roll 6-Pack (3.5g) climbed 15.5% at rank 2. Two flower SKUs sit inside the top 10 while three edibles occupy ranks 6, 8, and 9, indicating a pivot away from confections as tinctures at ranks 3 and 4 split directions with +0.1% and -39.9%. The pattern implies Peak Extracts is consolidating around inhalables as edibles lose momentum and tinctures fragment, pressuring merchandising toward fewer chocolate SKUs and more pre-roll support.
Top Selling Cannabis Brands
Data for this report comes from real-time sales reporting by participating cannabis retailers via their point-of-sale systems, which are linked up with Headset’s business intelligence software. Headset’s data is very reliable, as it comes digitally direct from our partner retailers. However, the potential does exist for misreporting in the instance of duplicates, incorrectly classified products, inaccurate entry of products into point-of-sale systems, or even simple human error at the point of purchase. Thus, there is a slight margin of error to consider. Brands listed on this page are ranked in the top twenty within the market and product category by total retail sales volume.

