.svg)
Sep-2026
Sales
Trend
6-Month
Product Count
SKUs
Avg Price
YoY Sales Change
YoY Price Change


Where to Buy
Bossy is stocked at 194 licensed dispensaries across Michigan and Oklahoma, 191 of them in Michigan, with the deepest coverage in New Buffalo, Detroit, Flint, Monroe, and Grand Rapids. Search by ZIP code or city below to find the closest one, or filter by product type if you are after a specific format.
Market Insights Snapshot
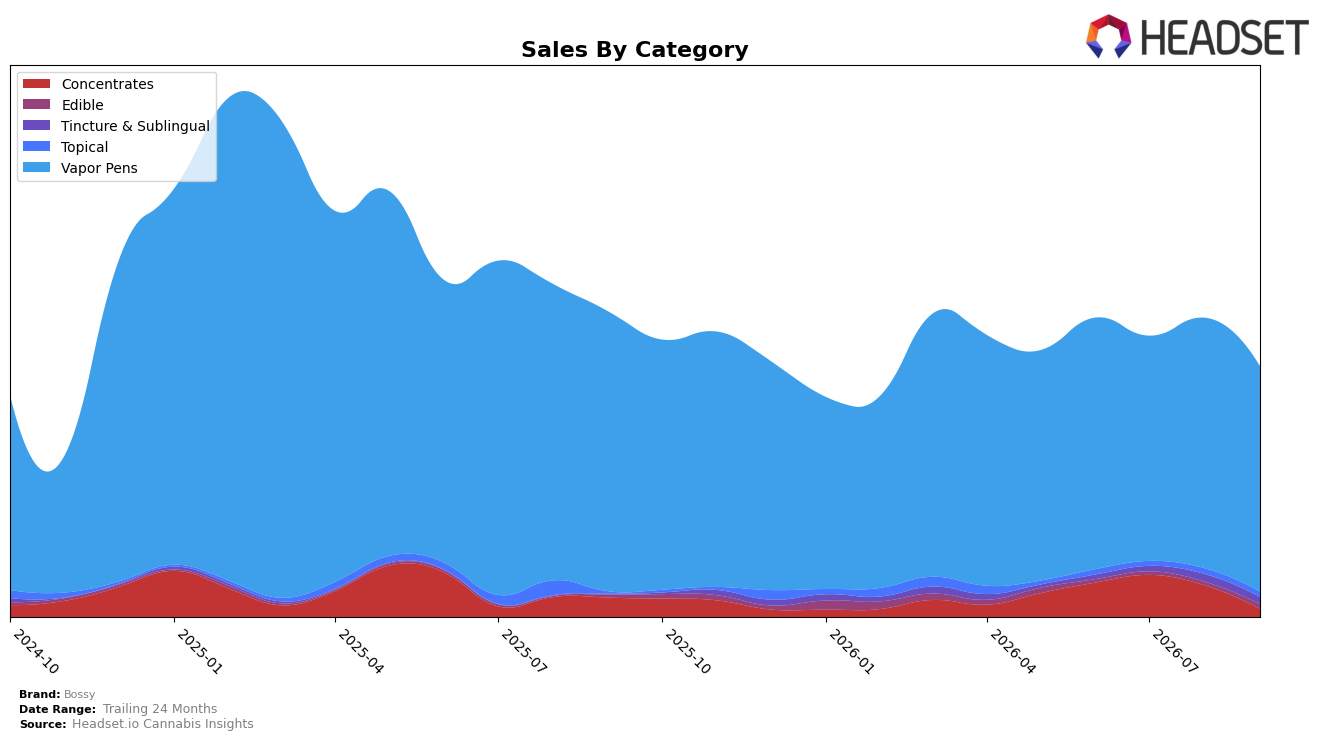
Bossy concentrated 89.80% of September 2026 sales in Vapor Pens, where year-over-year sales fell 19.46% and month-over-month declined 10.04%, while the brand’s overall sales were down 17.91% YoY and average price rose 31.97%. Smaller categories moved unevenly: Concentrates collapsed 57.48% YoY and 73.88% MoM to 3.31% share, while Tincture & Sublingual surged 856.06% YoY but slipped 6.44% MoM to 2.86% share, and Topical grew 116.51% YoY with a 7.68% MoM pullback to 2.13% share; Edible advanced 52.98% YoY and 30.29% MoM to 1.90% share. With Vapor Pens anchoring mix and posting a double-digit MoM contraction alongside a price lift to $5.61 on average and $5.37 in Vapor Pens, the thesis is that category concentration amplified the overall YoY decline while nascent diversification only partially offset September’s sequential softness.
Given a 35 rank in Vapor Pens in Michigan, the 10.04% MoM drop in the core category likely pressures visibility, while outsized YoY gains in Tincture & Sublingual (856.06%) and Topical (116.51%) indicate traction in therapeutic or niche formats without yet shifting the center of gravity. The 30.29% MoM lift in Edible against a 73.88% MoM decline in Concentrates suggests consumer trade-down or form-factor substitution toward lower-priced ingestion, consistent with Bossy’s 31.97% YoY average price increase compressing unit velocity. The positioning implication is a need to rebalance reliance on Vapor Pens by leaning into Edible momentum and stabilizing Tincture & Sublingual, using these categories to buffer rank volatility in Vapor Pens while pricing in the core is recalibrated.
Competitive Landscape
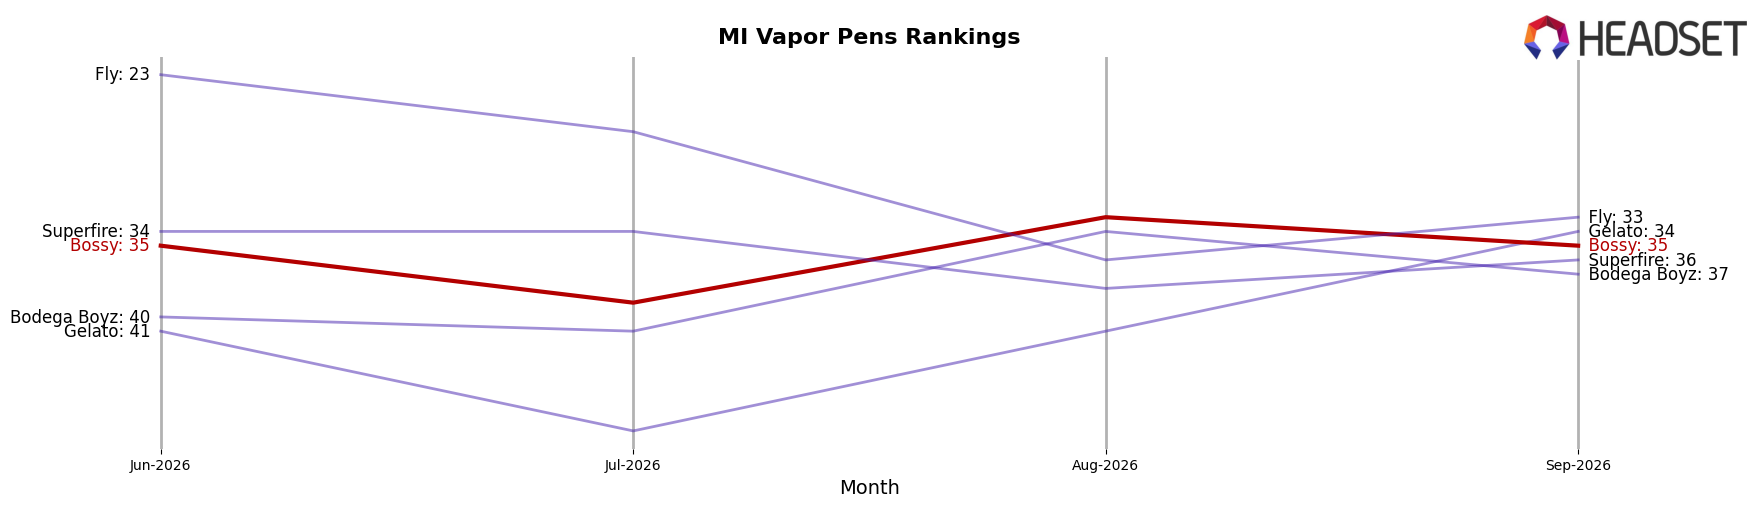
Bossy sits at rank #35 in MI Vapor Pens in September 2026, down 10 places year over year from #25, and flat versus June 2026 at #35; this trails its peak of #18 in February 2025 by 17 positions and contrasts with MKX Oil Company holding #1 while rising 2 ranks YoY from #3, and Society C jumping 8 ranks YoY from #12 to #4 alongside a 276.17% sales increase. With Platinum Vape steady near the top five despite a 1.38% sales decline and Muha Meds sliding 1 rank YoY from #2 to #3 amid a 27.71% sales drop, Bossy’s 10-rank YoY decline and three-month stagnation at #35 imply it is losing relative velocity in a tier where upward mobility is currently concentrated among a few brands making large rank or percentage moves.
Notable Products
Peaches & Cream Distillate Cartridge (1g) posted the standout move in September 2026 with +58.9% month over month to rank 2, while Blueberry Diesel Distillate Cartridge (1g) fell -13.5% at rank 3, signaling a reshuffle just below the leader. Premium Strawberry Kush Distillate Cartridge (1g) held rank 1 despite a -8.1% MoM dip, as Blueberry Pancake Distillate Cartridge (1g) plunged -42.9% at rank 6, indicating volatility within adjacent flavor profiles. Eight of the top ten SKUs are Vapor Pens from the same distillate family, concentrating category exposure even as one SKU added roughly $26,102 in sales and another contracted sharply. The pattern points to Bossy leaning into a narrower set of fast-cycling flavors within Vapor Pens, prioritizing velocity over breadth to sustain rank leadership.
Top Selling Cannabis Brands






Data for this report comes from real-time sales reporting by participating cannabis retailers via their point-of-sale systems, which are linked up with Headset’s business intelligence software. Headset’s data is very reliable, as it comes digitally direct from our partner retailers. However, the potential does exist for misreporting in the instance of duplicates, incorrectly classified products, inaccurate entry of products into point-of-sale systems, or even simple human error at the point of purchase. Thus, there is a slight margin of error to consider. Brands listed on this page are ranked in the top twenty within the market and product category by total retail sales volume.

