.svg)


Where to Buy
Bonsai Cultivation is stocked at 59 licensed dispensaries across Colorado, Oregon, and Montana, 45 of them in Colorado, with the deepest coverage in Colorado Springs, Denver, Boulder, Longmont, and Pueblo West. Search by ZIP code or city below to find the closest one, or filter by product type if you are after a specific format.
Market Insights Snapshot
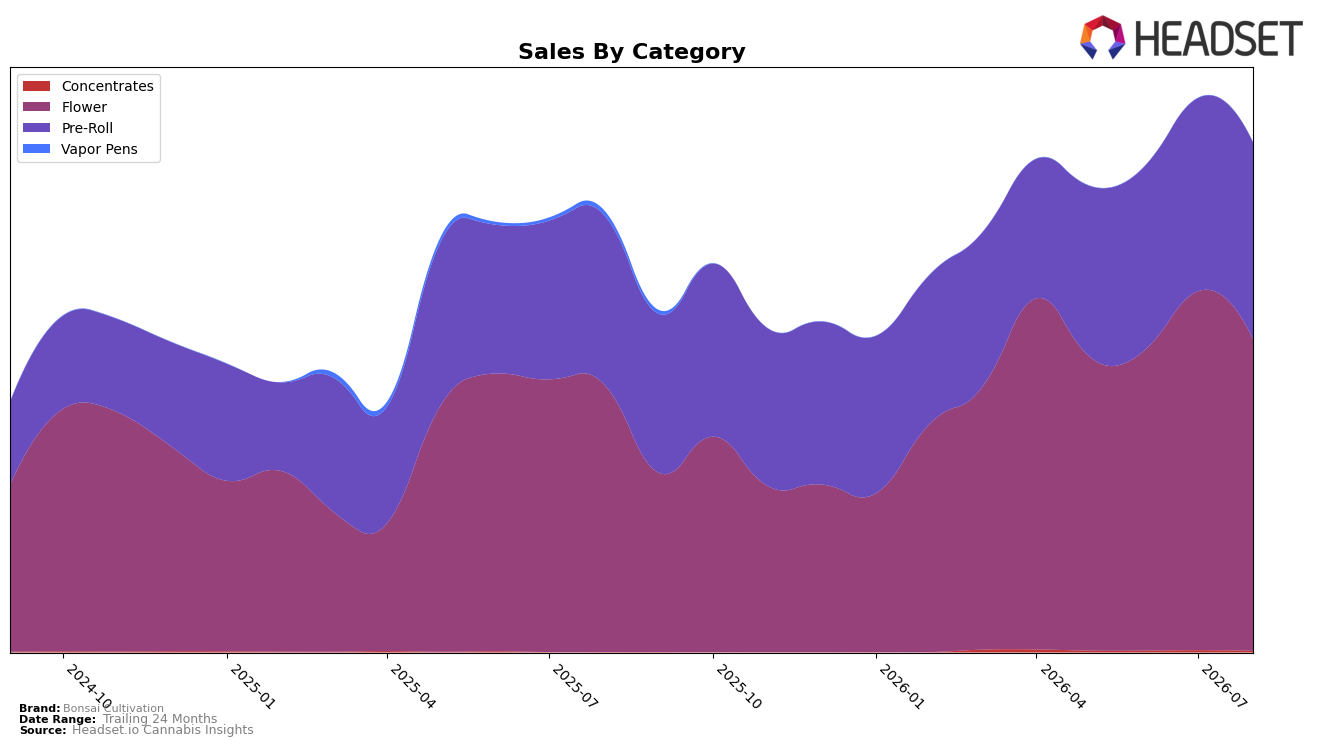
In August 2026, Bonsai Cultivation’s mix tilted toward Flower at 61.07% share (rank 15 in Flower within Colorado), while Pre-Roll held 38.67% and Concentrates remained marginal at 0.26%. Year over year, Flower grew 16.18% and Pre-Roll grew 16.22%, but month over month Flower fell 13.46% as Pre-Roll rose 1.81%, producing a short-term substitution effect despite a 7.10% YoY increase in average price. Concentrates posted a 1,236.38% YoY surge from a small base but declined 31.59% MoM, indicating volatility without material share shift; the pattern implies the brand’s August volume leaned more on Pre-Roll to offset Flower’s monthly dip while maintaining a Flower-led identity.
The combination of a 16.18% YoY Flower gain and a 13.46% MoM Flower pullback alongside a 1.81% MoM Pre-Roll uptick implies sensitivity to near-term price or promotion dynamics, with category switching contained within a stable two-category core. With Pre-Roll at 38.67% share and Flower ranked 15 in Colorado, the current mix suggests defensible mid-pack Flower positioning paired with tactical Pre-Roll momentum; the outsized 1,236.38% YoY in Concentrates at 0.26% share and a 31.59% MoM decline signals optionality rather than a strategic pivot, implying the path forward hinges on stabilizing Flower throughput while using Pre-Roll growth to smooth monthly variability.
Competitive Landscape
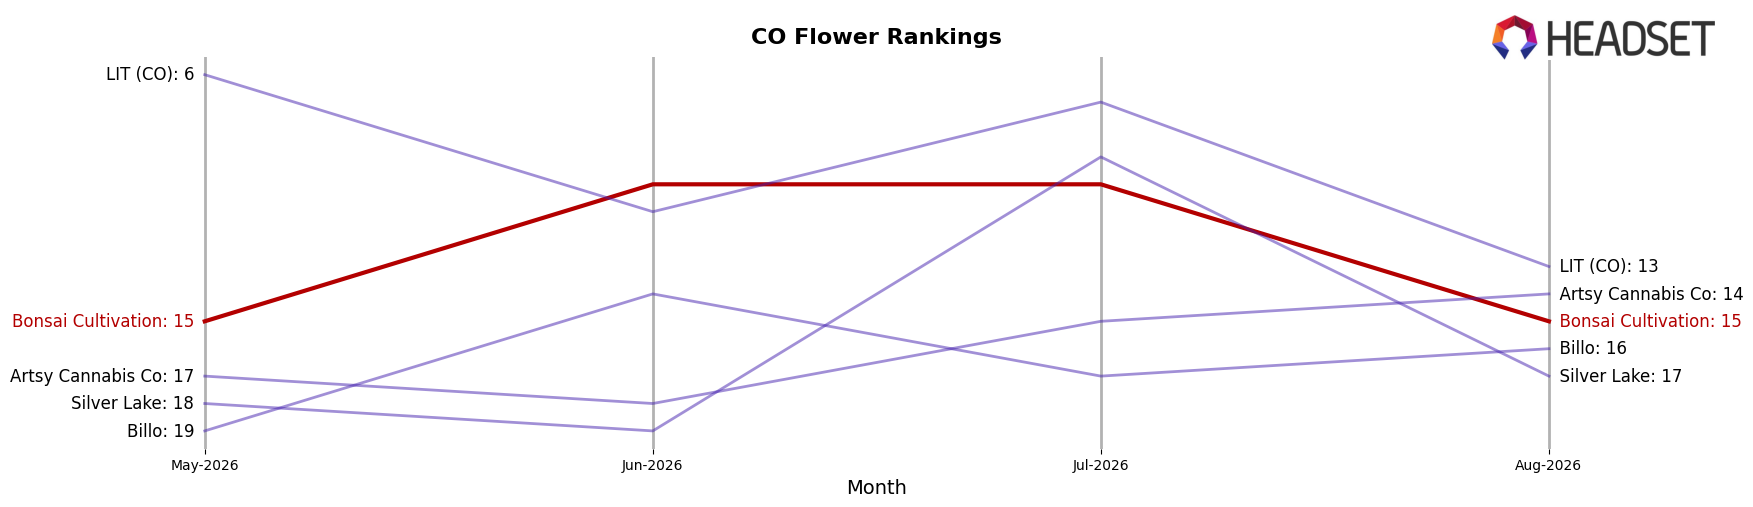
Bonsai Cultivation sits at rank 15 in August 2026, down 6 positions year over year from rank 9, and unchanged versus May 2026 when it was also rank 15; the brand’s peak of rank 7 in April 2026 contrasts with a three-month stagnation at rank 15, indicating slippage against faster movers. In contrast, Seed & Strain Cannabis Co. climbed from rank 2 to rank 1 with 46.9% YoY sales growth, while Green Dot Labs advanced from rank 5 to rank 3 on 38.2% YoY growth; meanwhile, Good Chemistry Nurseries fell from rank 3 to rank 5 amid a 7.1% YoY sales decline. The pattern implies Bonsai Cultivation’s rank trajectory is drifting toward the middle tier as momentum concentrates in ascending leaders, and recovery back toward the April 2026 peak would require outpacing competitors that have posted 20–47% YoY gains.
Notable Products
Energy Pre-Roll (1g) fell 8.1% month over month to rank 1 while Creativity Pre-Roll (1g) edged up 2.5% at rank 2, signaling share stability concentrated at the top despite a negative leader. Relaxation Pre-Roll (1g) rose 17.3% at rank 3 and Creativity Pre-Roll 2-Pack (1g) advanced 20.1% at rank 6, and with six of the top ten in the Pre-Roll family, the assortment tilts toward single-serve and small multi-pack formats. Guava Melt (Bulk) gained 18.4% at rank 8 while Blueberry Muffin (Bulk) sat at rank 10 on $42,603, indicating Flower is participating in growth but remains second-tier to Pre-Roll. The pattern implies Bonsai Cultivation is consolidating a Pre-Roll-led lineup where incremental gains in mid-ranked SKUs offset softness in the flagship, guiding near-term focus to depth in Pre-Roll variants over broad Flower expansion.
Top Selling Cannabis Brands






Data for this report comes from real-time sales reporting by participating cannabis retailers via their point-of-sale systems, which are linked up with Headset’s business intelligence software. Headset’s data is very reliable, as it comes digitally direct from our partner retailers. However, the potential does exist for misreporting in the instance of duplicates, incorrectly classified products, inaccurate entry of products into point-of-sale systems, or even simple human error at the point of purchase. Thus, there is a slight margin of error to consider. Brands listed on this page are ranked in the top twenty within the market and product category by total retail sales volume.

