Jun-2026
Sales
Trend
6-Month
Product Count
SKUs
Avg Price
YoY Sales Change
YoY Price Change
Market Insights Snapshot
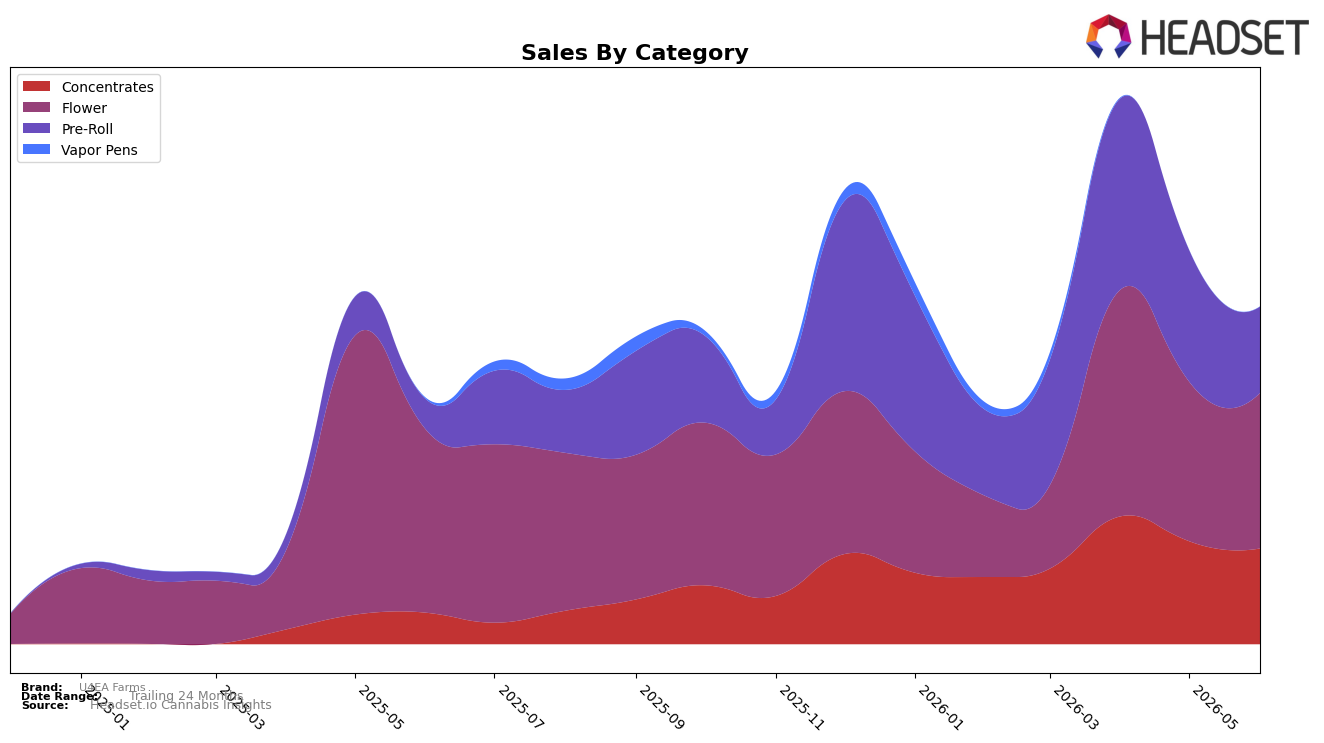
U4EA Farms’ June 2026 mix leans on Flower at 46.08% share with a year-over-year decline of 15.07% and a month-over-month dip of 2.53%, while Concentrates account for 28.36% share with a 205.13% year-over-year surge but a 7.07% month-over-month pullback. Pre-Roll holds 25.56% share with 185.56% year-over-year growth yet a 34.48% month-over-month contraction, and the overall brand sales rose 37.27% year over year alongside a 35.11% decline in average price to $16.64. The pattern implies price-led volume capture concentrated in Concentrates and Pre-Roll for year-over-year momentum, but near-term softness in all three categories in June 2026 introduces exposure to short-cycle demand swings.
Within Massachusetts Concentrates, U4EA Farms sits at rank 29, which, paired with a 28.36% internal mix share and a 205.13% year-over-year rise, indicates mid-pack category presence despite rapid expansion. The combination of a 34.48% month-over-month drop in Pre-Roll and a 7.07% month-over-month decline in Concentrates suggests recent promotional or supply cadence shifts, while a 2.53% month-over-month dip in Flower points to limited ballast from the largest line. The implication is that U4EA Farms is positioned as a value-forward, growth-seeking player relying on aggressive pricing to scale in Concentrates and Pre-Roll, but it must stabilize month-over-month variability to translate year-over-year gains into sustained rank improvement.
Competitive Landscape
U4EA Farms sits at rank #29 in June 2026 in MA Concentrates, improving 30 places from #59 year over year, and up 7 positions from #36 three months ago, while peaking at #23 in April 2026; meanwhile, Good Chemistry Nurseries held at #1 year over year with a 31.3% sales increase, and Crispy Commission Concentrates remained #2 despite a 23.7% sales decline. The mix of U4EA Farms’ upward rank movement (+30 YoY and +7 versus three months) alongside competitors’ divergent sales shifts (+31.3% at #1 and -23.7% at #2) implies U4EA Farms is gaining share through consistency rather than category-wide tailwinds, signaling a trajectory toward mid-tier stability if momentum is maintained.

Notable Products
Mad Honey Pre-Roll (1g) delivered the standout move in June 2026 with an 87.6% month-over-month gain to rank 1, while Permanent Marker Pre-Roll (1g) plunged 53.8% to rank 3. Gas Face Pre-Roll (1g) also fell 41.5% at rank 2, and Where's My Bike Pre-Roll (1g) dropped 59.1% at rank 8, indicating a split within Pre-Rolls where a single winner offsets multiple double-digit decliners. Four of the top ten are Pre-Roll SKUs, but only one posted a gain over +50%, which implies the lineup is over-reliant on one hero Pre-Roll amid broader softness. This pattern suggests U4EA Farms is pivoting toward a focused hero-SKU strategy in Pre-Rolls while Flower stabilizes the base, as Gas Face (3.5g) rose 11.8% at rank 4 and anchors dollar volume near $12.5k.
Top Selling Cannabis Brands
Data for this report comes from real-time sales reporting by participating cannabis retailers via their point-of-sale systems, which are linked up with Headset’s business intelligence software. Headset’s data is very reliable, as it comes digitally direct from our partner retailers. However, the potential does exist for misreporting in the instance of duplicates, incorrectly classified products, inaccurate entry of products into point-of-sale systems, or even simple human error at the point of purchase. Thus, there is a slight margin of error to consider. Brands listed on this page are ranked in the top twenty within the market and product category by total retail sales volume.

