Jun-2026
Sales
Trend
6-Month
Product Count
SKUs
Avg Price
YoY Sales Change
YoY Price Change
Market Insights Snapshot
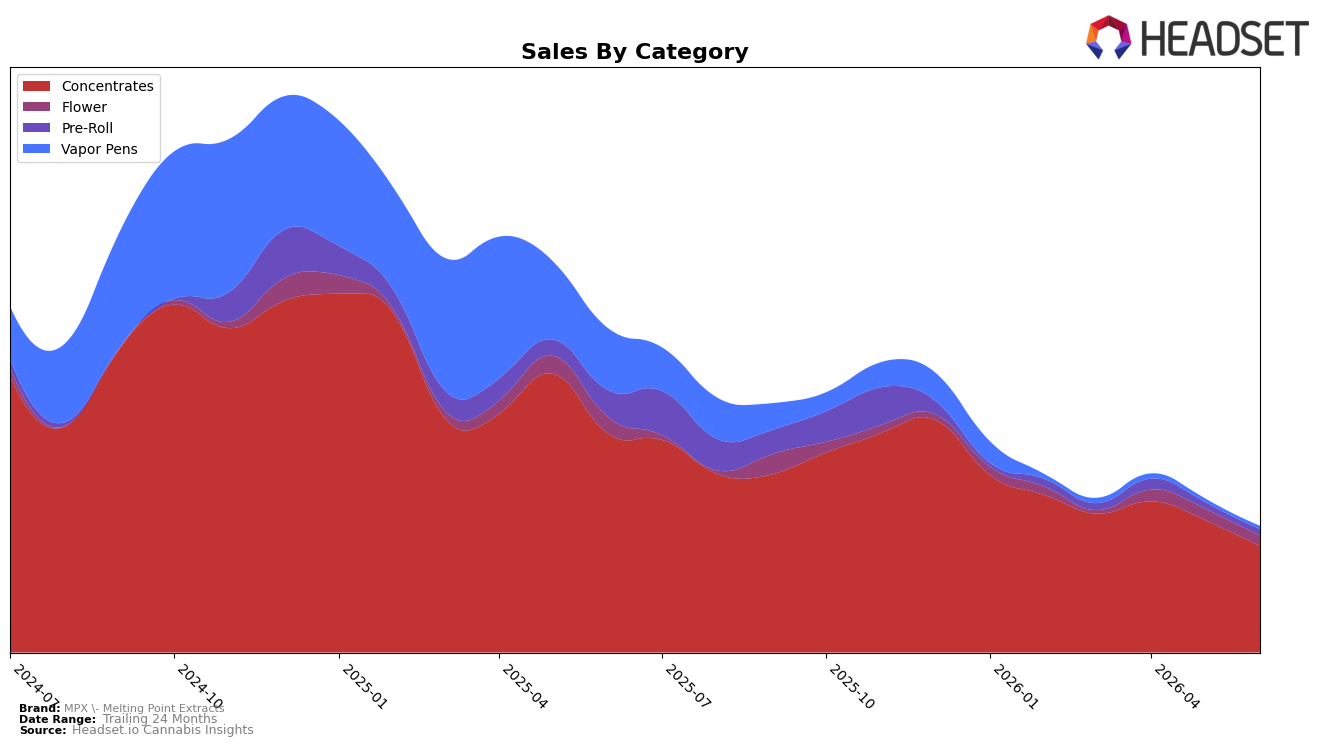
In June 2026, MPX - Melting Point Extracts concentrated further into Concentrates at 83.81% share while the segment fell 51.31% year over year and 19.75% month over month, pulling overall sales down 60.83% YoY despite a 6.48% YoY increase in average price. Secondary categories offered limited offset: Flower held 8.37% share with sales down 35.99% YoY and 7.81% MoM, Pre-Roll at 5.14% share contracted 75.94% YoY and 5.21% MoM, and Vapor Pens at 2.69% share declined 94.49% YoY and 6.53% MoM. With Concentrates ranked 10th in New Jersey, the mix concentrates risk into a weakening core while smaller formats are too small to cushion volatility, implying the brand’s near-term volume hinges on stabilizing the flagship category rather than portfolio breadth.
The pattern implies a positioning that is expert-led in Concentrates but vulnerable to category downturns, as an 83.81% reliance amplifies each 10% category swing into brand-level variance, evidenced by the 19.75% MoM drop translating into broad declines across the portfolio. The simultaneous price upshift to $34.95 average alongside a 51.31% YoY fall in Concentrates volume suggests a value-per-gram stance that could be misaligned with demand elasticity, while Flower’s 8.37% share and 7.81% MoM decline show limited traction as a hedge. Holding the 10th rank in New Jersey Concentrates indicates mid-pack visibility; without a deliberate rebalancing toward steadier categories or tighter price-pack architecture in Concentrates, the brand remains positioned for rank compression when category softness repeats.
Competitive Landscape
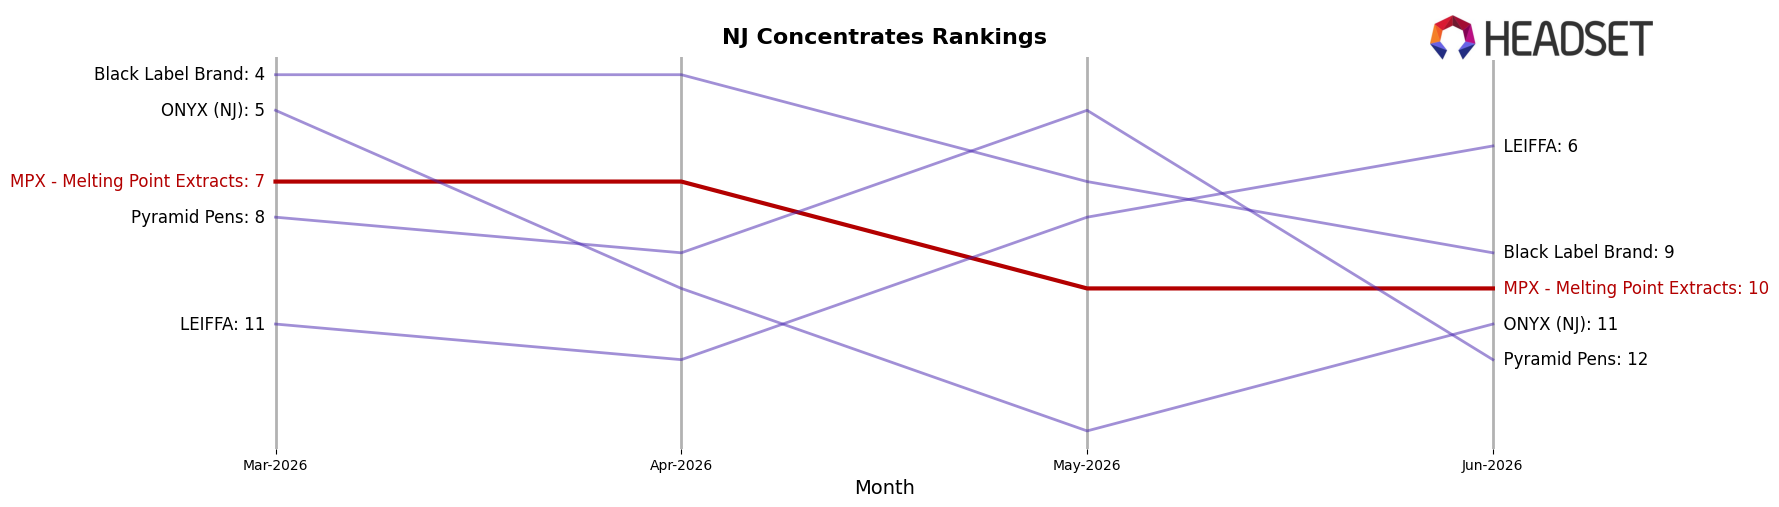
MPX - Melting Point Extracts sits at rank #10 in June 2026 in NJ Concentrates, down 4 positions year over year from #6, and 3 spots below its March 2026 placement at #7; the brand’s peak was #4 in January 2026, marking a 6-rank slide from that high. Competitive context tightened as Grassroots moved from #2 to #1 with a 23.9% YoY sales increase while MPX - Melting Point Extracts dropped 4 ranks, and Shady Extracts climbed from #16 to #5 with 177.5% YoY growth as MPX - Melting Point Extracts fell 3 places since March 2026. The pattern implies MPX - Melting Point Extracts is losing relative share of attention to faster-rising competitors, indicating that without a reversal the brand is likely to stabilize below the top 10 rather than re-approach its January 2026 peak.
Notable Products
Skunk Live Resin Sugar (1g) posted the steepest month-over-month decline at -27.2% while holding rank 6, and Red Zushi Shatter (1g) also fell -21.6% at rank 8. Orange Drizzle Shatter (1g) remained the top SKU at rank 1 despite a -3.7% dip, suggesting price elasticity or inventory friction more than demand collapse. With seven of the top ten in Concentrates and the sole Flower entry at rank 7, the mix is anchored in extracts rather than smokable formats. This pattern implies MPX - Melting Point Extracts is leaning into a concentrates-led portfolio where volatility in a few live resin SKUs may require tighter rotation and pricing to defend top-tier positions.
Top Selling Cannabis Brands
Data for this report comes from real-time sales reporting by participating cannabis retailers via their point-of-sale systems, which are linked up with Headset’s business intelligence software. Headset’s data is very reliable, as it comes digitally direct from our partner retailers. However, the potential does exist for misreporting in the instance of duplicates, incorrectly classified products, inaccurate entry of products into point-of-sale systems, or even simple human error at the point of purchase. Thus, there is a slight margin of error to consider. Brands listed on this page are ranked in the top twenty within the market and product category by total retail sales volume.

