Jun-2026
Sales
Trend
6-Month
Product Count
SKUs
Avg Price
YoY Sales Change
YoY Price Change
Market Insights Snapshot
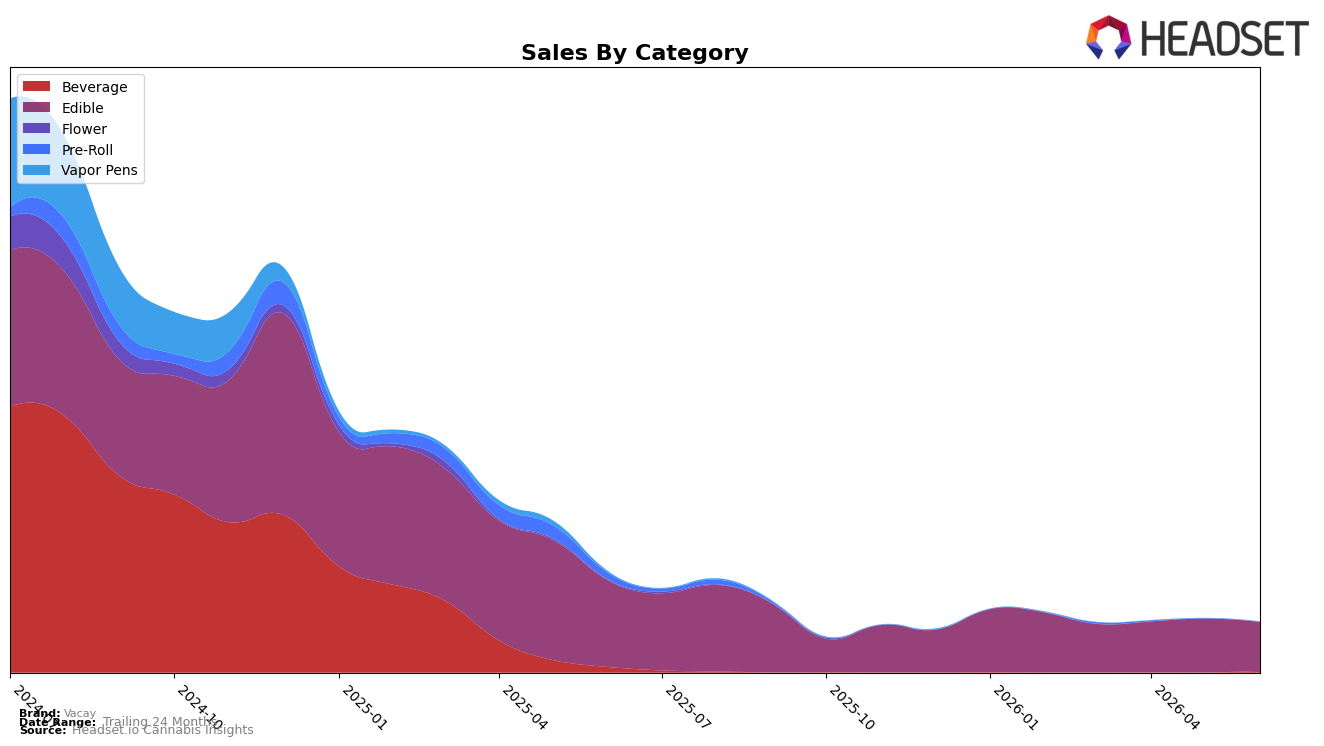
Vacay’s category mix in June 2026 is highly concentrated, with Edible holding 96.84% share and Beverage at 3.16%, while overall brand sales fell 49.95% year over year and 91.18% over 24 months. Within Edible, sales declined 43.84% year over year and 9.35% month over month, alongside a 10.03% year-over-year decrease in average price to $6.19, indicating demand and/or pricing pressure concentrated in the core line. Beverage posted a 70.61% year-over-year drop with no reported month-over-month figure, and carries a higher average price of $7.48; the mix implies that even small shifts in Edible have outsized impact on total performance. The pattern implies Vacay is overexposed to a weakening Edible base in British Columbia, where category-specific declines can erase gains from any nascent Beverage activity.
The steep 43.84% year-over-year and 9.35% month-over-month contractions in Edible, combined with a 3.16% Beverage share and 70.61% year-over-year fall in that smaller line, suggest Vacay’s positioning is tethered to a single category with limited diversification coverage. With average price down 10.03% year over year to $6.19 while Beverage remains at a premium $7.48, the price ladder risks segmenting value-seeking Edible buyers away from higher-price extensions. The implication is a need to rebalance mix and price architecture so that incremental Beverage growth can offset Edible volatility, and to recalibrate Edible pack/price to reduce sensitivity to month-over-month shocks of roughly 9–10% in the core category.
Competitive Landscape
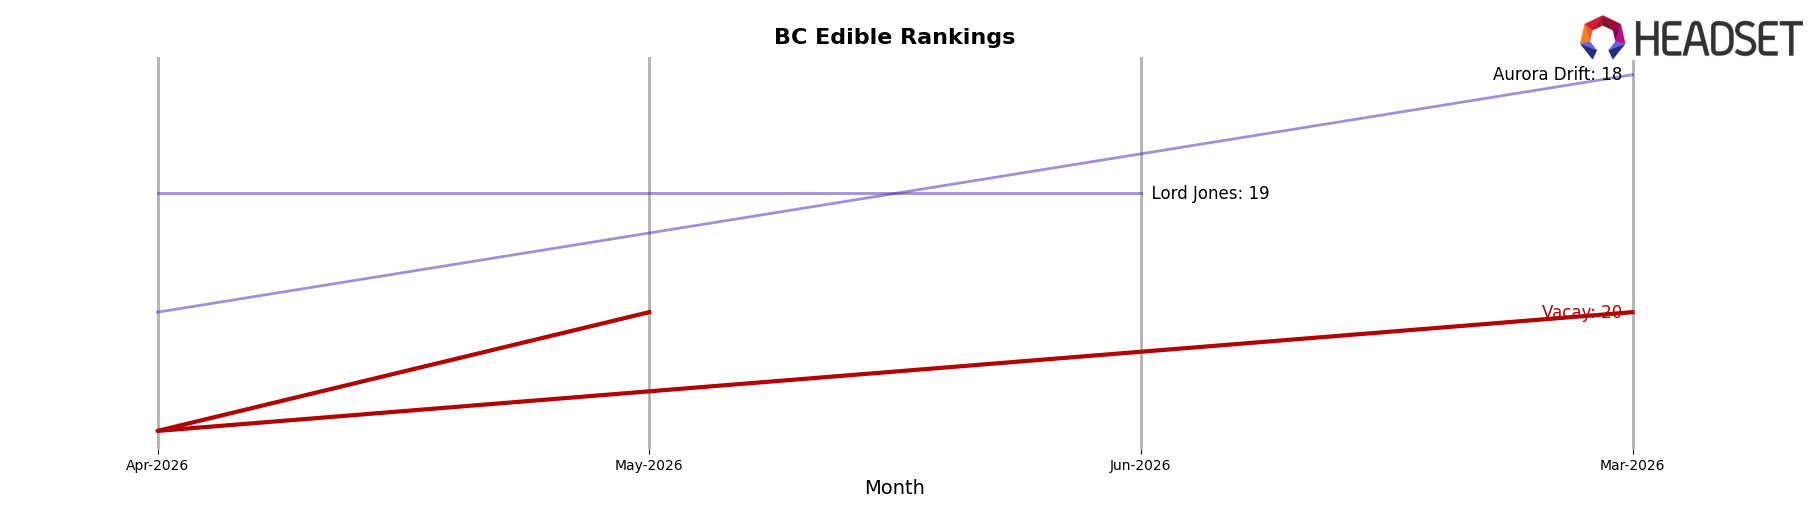
Vacay is ranked #21 in BC Edible in June 2026, improving 4 positions from #25 year over year, but slipping 1 spot from #20 in March 2026; compared with top peers, Spinach moved up from #2 to #1 while Gron / Grön fell from #1 to #3, and No Future climbed from #3 to #2 alongside a 94.0% YoY sales increase. Vacay’s current #21 sits six places below its peak #15 from June 2024, and with Wyld holding #4 on 118.2% YoY growth while 1964 Supply Co advanced from #6 to #5 on 67.4% YoY, the pattern implies Vacay’s incremental rank gains are being outpaced by faster-moving leaders, suggesting the current trajectory will keep the brand mid-pack without a step-change in share capture.
Notable Products
Peanut Butter Chocolate Cup (10mg) set the tone in June 2026 with a -9.4% month-over-month slide while holding rank 1, indicating demand concentrated in a single edible even as velocity cooled. Sparkling Pink Lemonade (10mg THC, 355ml) entered at rank 2 with no prior baseline and CBD/THC 1:1 Island Punch Soda (10mg CBD, 10mg THC, 355ml) arrived at rank 3, putting two Beverages in the top three and signaling a format diversification despite the edible leader’s dip. With three of the top four slots occupied by Edible and Beverage SKUs, and the edible anchor accounting for $25,587 alongside a -9.4% change versus a fresh Beverage push at ranks 2 and 3, the mix points to Vacay tilting from single-SKU reliance toward a wider portfolio that can cushion volatility in the flagship.
Top Selling Cannabis Brands
Data for this report comes from real-time sales reporting by participating cannabis retailers via their point-of-sale systems, which are linked up with Headset’s business intelligence software. Headset’s data is very reliable, as it comes digitally direct from our partner retailers. However, the potential does exist for misreporting in the instance of duplicates, incorrectly classified products, inaccurate entry of products into point-of-sale systems, or even simple human error at the point of purchase. Thus, there is a slight margin of error to consider. Brands listed on this page are ranked in the top twenty within the market and product category by total retail sales volume.

