Jun-2026
Sales
Trend
6-Month
Product Count
SKUs
Avg Price
YoY Sales Change
YoY Price Change
Market Insights Snapshot
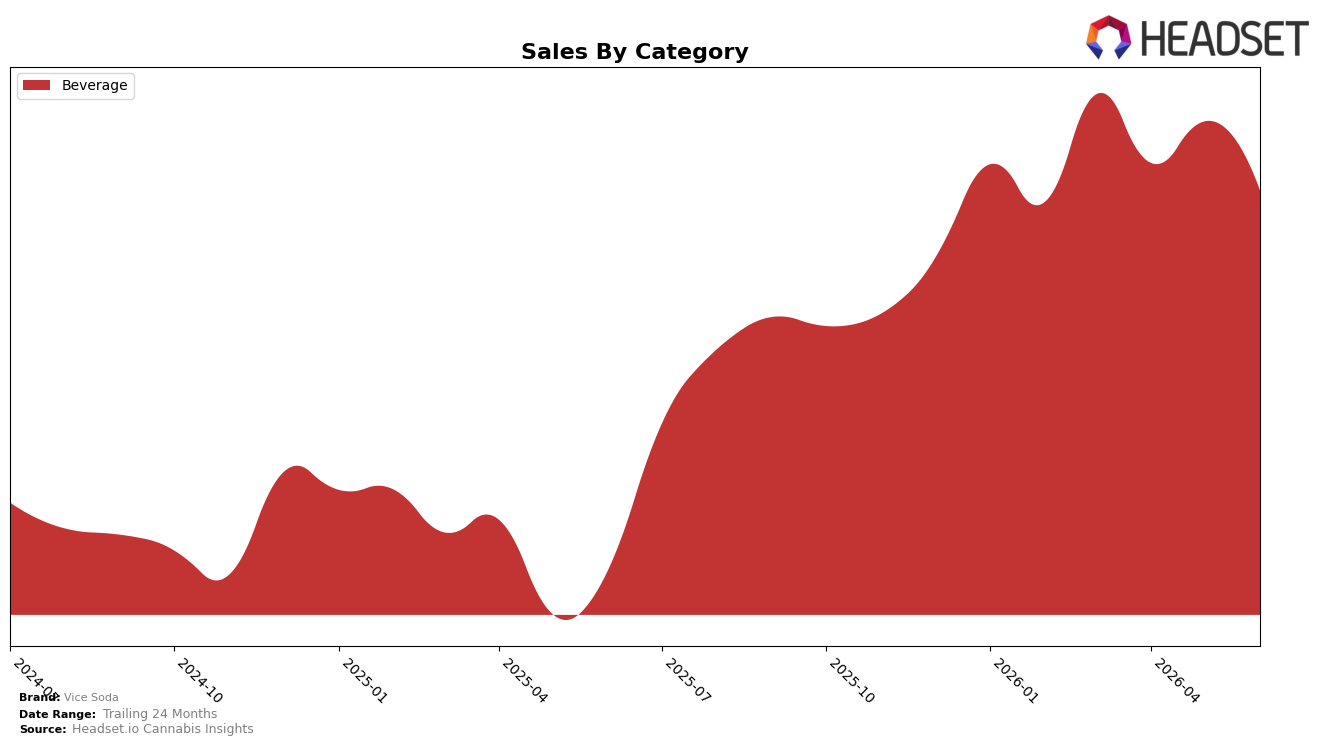
In June 2026, Vice Soda operated as a single-category brand with Beverage at 100.0% mix, posting 240.7% year-over-year growth while registering an 11.4% month-over-month decline; the average price rose 16.1% year over year even as category sales slipped versus May 2026. With Washington anchoring performance and a rank of 17 in Beverage, the combination of triple-digit annual expansion alongside a sub-12% monthly pullback indicates demand acceleration on a yearly basis but near-term deceleration, implying price-led value capture amid cooling sequential velocity.
The shift toward higher pricing alongside a full concentration in Beverage positions Vice Soda as a focused player trading up within its lane, with 16.1% pricing growth coexisting with 240.7% sales expansion but a -11.4% monthly step-down. Holding rank 17 in Washington Beverage against a 100.0% category mix implies that June 2026 performance depends on deepening share within a single shelf rather than portfolio diversification, suggesting the path forward is tightening price pack architecture to stabilize month-to-month sell-through while preserving the year-over-year trajectory.
Competitive Landscape
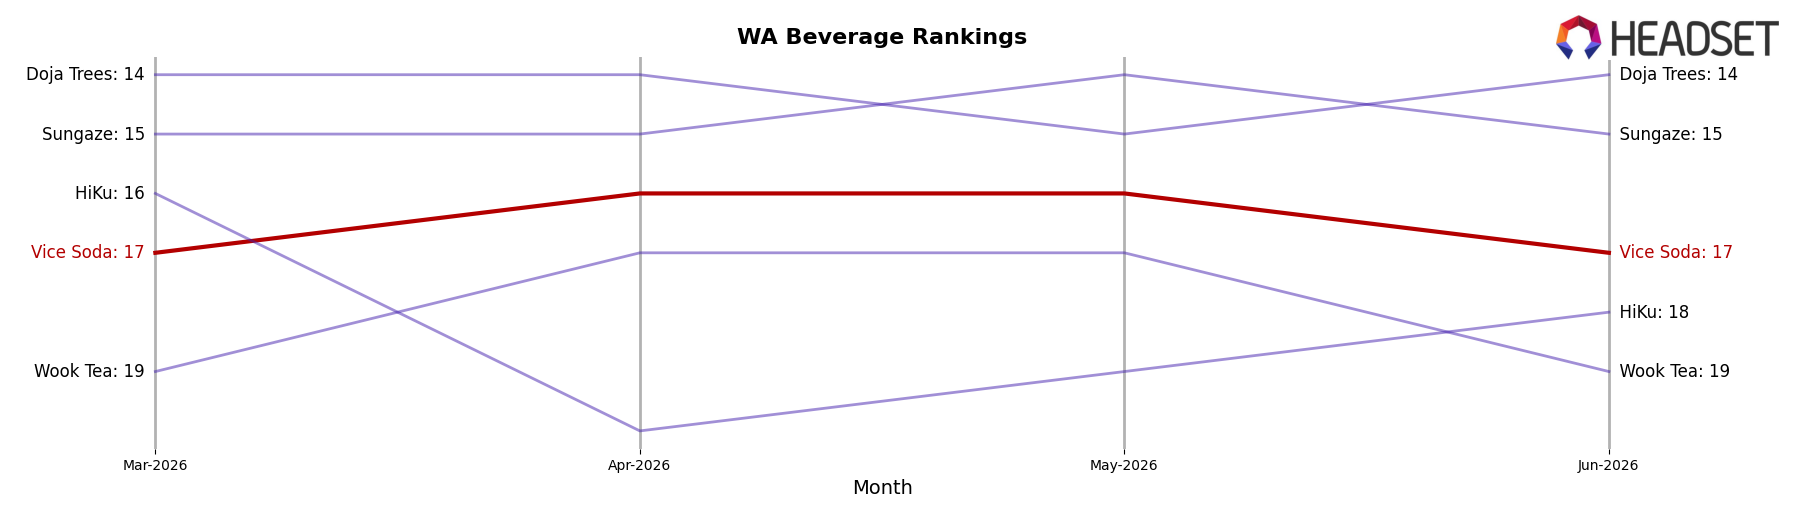
Vice Soda sits at #17 in WA Beverage for June 2026, improving 5 positions from #22 year over year, while holding flat versus March 2026 at #17 and coming off a peak of #16 in May 2026; this contrasts with Journeyman edging up from #2 to #1 (+1 rank) and Ray's Lemonade slipping from #1 to #2 (−1 rank) alongside a −30.3% sales change, as Blaze Soda advanced from #8 to #5 (+3 ranks) with +65.7% sales growth; the pattern—incremental rank gain year over year but stagnation over the last three months—implies Vice Soda is stabilizing mid-pack and must convert short-term plateaus into sustained climbs to escape the #15–#20 corridor.
Notable Products
CBG/THC 1:1 Mango Ice Tea (100mg CBG, 100mg THC, 12oz) posted the steepest decline in June 2026 at -36.2% MoM while sitting at rank 5, and CBG/THC 1:1 Grapefruit Soda (100mg CBG, 100mg THC, 12oz) fell -15.6% MoM at rank 3. The category is concentrated, with ten of the top ten as Beverage SKUs and the leader CBD/CBN/THC 20:1:20 Blackberry Cream Soda (100mg CBD, 5mg CBN, 100mg THC 12oz) slipping -1.2% MoM yet holding rank 1. With Starfruit Soda (100mg THC, 12oz) up 22.1% MoM at rank 6 against broad double-digit declines in ranks 3, 5, 7, 8, and 9, the mix implies flavor-driven volatility where legacy CBG/THC 1:1 variants are shedding share to single-THC novelty flavors. The pattern points to near-term gains by distinctive THC-only SKUs and pressure on parity-flavor 1:1 teas, suggesting assortment pruning in teas and incremental bets on unique fruit sodas.
Top Selling Cannabis Brands
Data for this report comes from real-time sales reporting by participating cannabis retailers via their point-of-sale systems, which are linked up with Headset’s business intelligence software. Headset’s data is very reliable, as it comes digitally direct from our partner retailers. However, the potential does exist for misreporting in the instance of duplicates, incorrectly classified products, inaccurate entry of products into point-of-sale systems, or even simple human error at the point of purchase. Thus, there is a slight margin of error to consider. Brands listed on this page are ranked in the top twenty within the market and product category by total retail sales volume.

