Jun-2026
Sales
Trend
6-Month
Product Count
SKUs
Avg Price
YoY Sales Change
YoY Price Change
Market Insights Snapshot
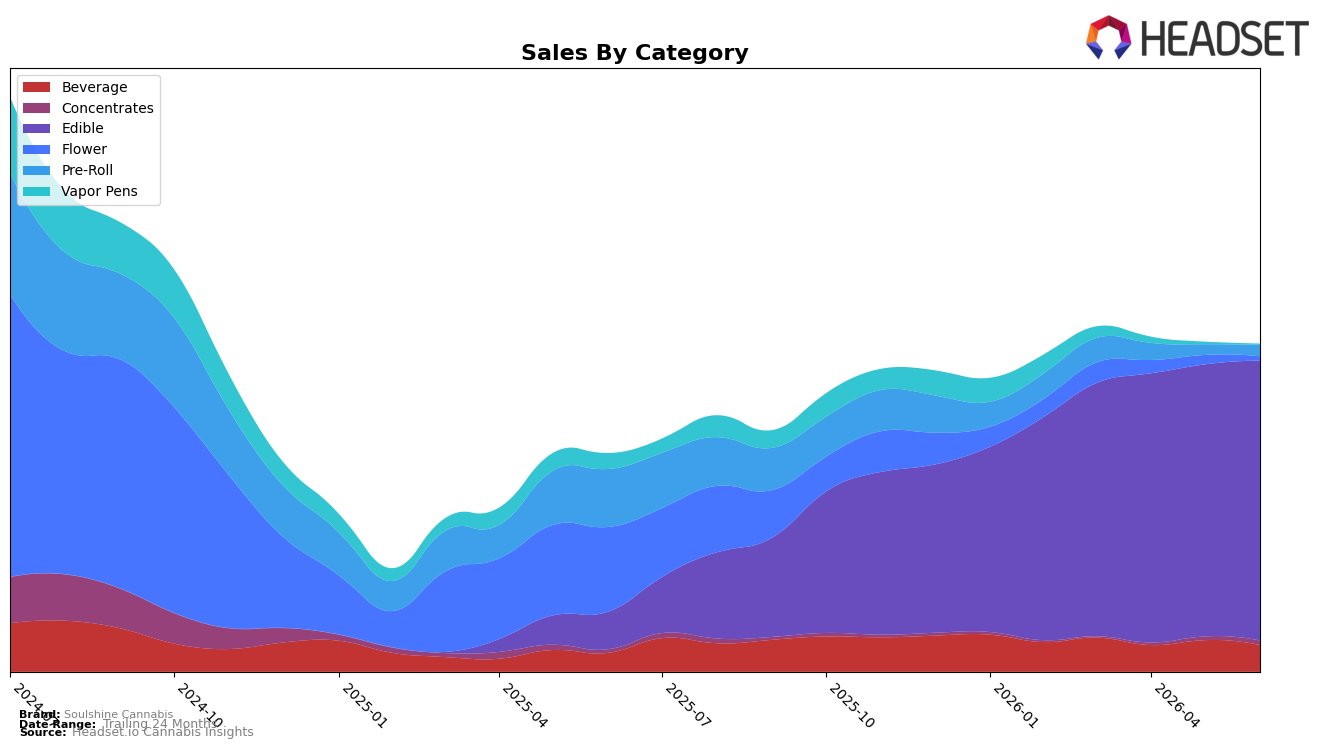
Soulshine Cannabis concentrated 85.63% of June 2026 sales in Edible, with that category up 650.13% year over year and 2.93% month over month, while Beverage held 8.12% share with 41.47% YoY growth but a -15.57% MoM decline. Legacy inhalable formats contracted sharply: Pre-Roll dropped -80.56% YoY despite a 7.38% MoM uptick, Flower declined -95.28% YoY with a -56.70% MoM slide, and Vapor Pens fell -93.52% YoY and -56.52% MoM, leaving Concentrates as the only inhalable with concurrent growth at 25.57% YoY and 21.58% MoM. With Edible ranking 16th in Washington and average price up 2.29% YoY to $11.46, the pattern implies an intentional pivot toward ingestibles that is lifting total brand sales 50.38% YoY while de-emphasizing low-velocity inhalables.
The mix shift implies Soulshine Cannabis is consolidating demand around fewer, faster-moving SKUs, using Edible scale (85.63% share) to stabilize revenue while absorbing volatility from Beverage’s -15.57% MoM dip and the steep MoM contractions in Flower (-56.70%) and Vapor Pens (-56.52%). The simultaneous MoM gains in Edible (+2.93%), Pre-Roll (+7.38%), and Concentrates (+21.58%) suggest near-term experimentation at the edges of the portfolio, but the 16th-place Edible rank in Washington indicates headroom where incremental share capture in Edible would have outsized impact relative to attempting a wholesale rebound in categories down more than -80% YoY; the implication is that reinforcing ingestibles while selectively testing higher-margin inhalables could improve rank trajectory without diluting focus.
Competitive Landscape
Soulshine Cannabis sits at rank #16 in WA Edible in June 2026, a 17-place climb from #33 year over year, and up 2 spots from #18 in March 2026; this is also a peak rank, indicating the current positioning equals the best on record for the brand. In contrast, Wyld held steady at #1 year over year while growing sales by 7.3%, and Hot Sugar remained at #3 with sales down 1.8%, suggesting Soulshine Cannabis is gaining rank even as top incumbents either maintain position or contract slightly. With #2 Green Revolution expanding sales by 17.5% yet not changing rank, the pattern implies Soulshine Cannabis’s rank momentum is driven by mid-tier reshuffling rather than displacement of leaders, pointing to continued opportunity to consolidate share within the teens before challenging the top five.

Notable Products
Moon - CBD/CBN/THC 3:2:1 Mango Solventless Gummies 10-Pack (300mg CBD, 200mg CBN, 100mg THC) fell -15.36% month over month to rank 4 in June 2026, while Moon - CBD/CBN/THC 3:2:1 Blueberry Gummies 10-Pack (300mg CBD, 200mg CBN, 100mg THC) grew 8.08% to hold rank 1. Sun - CBD/CBG/THC 3:2:1 Watermelon Hash Rosin Gummies 10-Pack (300mg CBD, 200mg CBG, 100mg THC) jumped 34.10% yet remained outside the top three at rank 6, and Sun - CBD/CBG/THC 3:2:1 Peach Hash Rosin Gummies 10-Pack (300mg CBD, 200mg CBG, 100mg THC) slipped -9.61% at rank 8. With all ten top SKUs concentrated in Edibles and eight of the top ten in 3:2:1 minor-cannabinoid blends, the pattern implies Soulshine Cannabis is consolidating around balanced gummy formats rather than expanding into new categories.
Top Selling Cannabis Brands
Data for this report comes from real-time sales reporting by participating cannabis retailers via their point-of-sale systems, which are linked up with Headset’s business intelligence software. Headset’s data is very reliable, as it comes digitally direct from our partner retailers. However, the potential does exist for misreporting in the instance of duplicates, incorrectly classified products, inaccurate entry of products into point-of-sale systems, or even simple human error at the point of purchase. Thus, there is a slight margin of error to consider. Brands listed on this page are ranked in the top twenty within the market and product category by total retail sales volume.

