.svg)
Aug-2026
Sales
Trend
6-Month
Product Count
SKUs
Avg Price
YoY Sales Change
YoY Price Change


Where to Buy
Wook Tea is stocked at 74 licensed dispensaries across Washington, with the deepest coverage in Seattle, Everett, Spokane, Bellevue, and Bellingham. Search by ZIP code or city below to find the closest one, or filter by product type if you are after a specific format.
Market Insights Snapshot
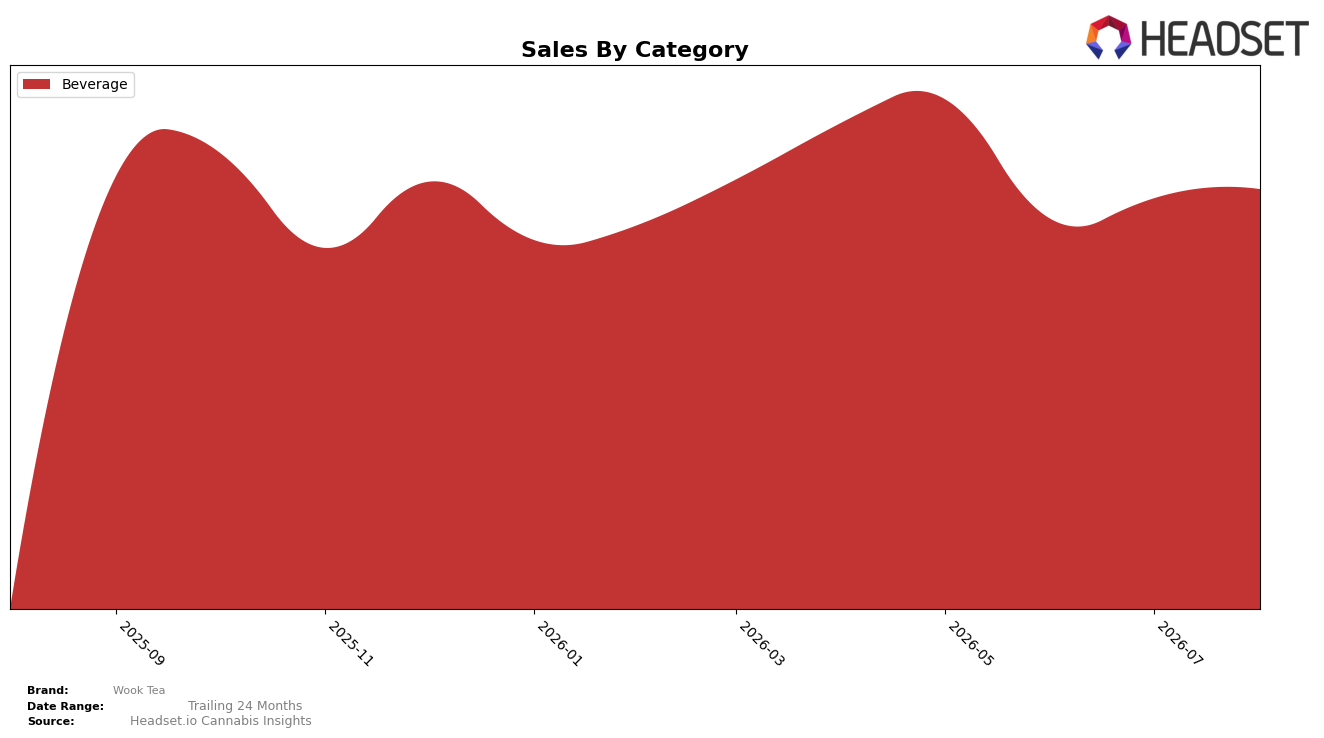
In August 2026, Wook Tea’s mix is fully concentrated in Beverage at 100.0% share, with category sales up 874.11% year over year and 2.01% month over month, while average price rose 5.76% YoY to $10.96. Within Washington Beverage, the brand sits at rank 18, indicating mid-pack placement despite the outsized 874.11% YoY surge and a modest 2.01% MoM uptick; the combination of an expanding price point and a single-category footprint implies growth is driven by distribution or velocity gains inside Beverage rather than mix diversification.
The move to rank 18 alongside a 100.0% Beverage concentration and a 2.01% MoM lift suggests that near-term momentum is incremental within the existing lane, and the 5.76% YoY price increase paired with 874.11% YoY sales growth points to demand elasticity favoring current positioning. The pattern implies Wook Tea is best positioned as a focused Beverage player in Washington, where sustaining rank advancement will likely hinge on deepening penetration and repeat within Beverage rather than cross-category expansion in the next few months.
Competitive Landscape
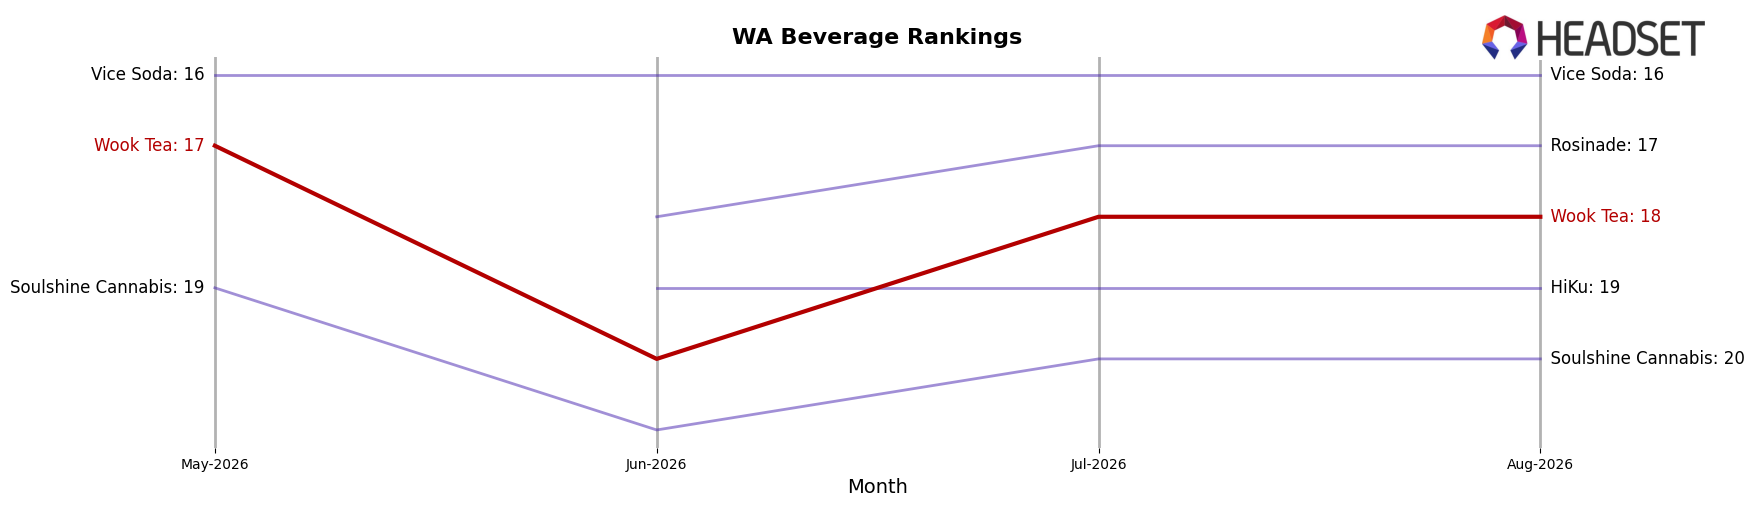
Wook Tea sits at rank #18 in WA Beverage for August 2026, improving 6 positions from #24 year over year and slipping 1 position from #17 three months ago; against its historical context, the brand remains 3 spots off its peak #15 from September 2025 while the top tier is volatile, with Journeyman edging up from #2 to #1 as its sales fell 5.25% year over year and Blaze Soda jumping from #9 to #4 alongside a 123.77% year-over-year sales increase. Compared with Ray's Lemonade sliding from #1 to #2 with a 31.59% sales decline and Green Revolution easing from #4 to #5 with a 38.59% drop, Wook Tea’s upward rank shift from #24 to #18 signals share recovery amid leader churn; the trajectory implies Wook Tea is positioned to contest for mid-tier gains if it can convert recent rank stability into a return toward its #15 peak.
Notable Products
Larry Palmer Ice Tea (100mg THC, 12oz) posted the standout movement in August 2026 with an 84.1% month-over-month rise to rank 4, while the Peach Ice Tea (100mg THC, 12oz, 355ml) fell 34.4% and the CBD/THC 1:1 Larry Palmer Wook Tea Yerba Mate Rosin Infused 10-Pack dropped 62.3% to rank 6. The top spot holder Gone Wild - CBD/CBG/CBC/THC 1:1:1:1 Mango Lemonade Caffeinated Rosin Ice Tea (100mg CBD, 100mg CBG, 100mg CBC, 100mg THC, 12oz, 355ml) slid 10.4% at rank 1 even as Blackberry Lemonade Ice Tea (100mg THC, 12oz, 355ml) rose 18.9% at rank 2, and five of the top five are single-serve Beverage SKUs, concentrating share away from multipacks. This mix implies Wook Tea is tilting toward caffeinated or flavor-forward single-serves that can swing quickly with promotions, while multipacks face demand compression that may require pricing or pack architecture changes.
Top Selling Cannabis Brands






Data for this report comes from real-time sales reporting by participating cannabis retailers via their point-of-sale systems, which are linked up with Headset’s business intelligence software. Headset’s data is very reliable, as it comes digitally direct from our partner retailers. However, the potential does exist for misreporting in the instance of duplicates, incorrectly classified products, inaccurate entry of products into point-of-sale systems, or even simple human error at the point of purchase. Thus, there is a slight margin of error to consider. Brands listed on this page are ranked in the top twenty within the market and product category by total retail sales volume.

