Jun-2026
Sales
Trend
6-Month
Product Count
SKUs
Avg Price
YoY Sales Change
YoY Price Change
Market Insights Snapshot
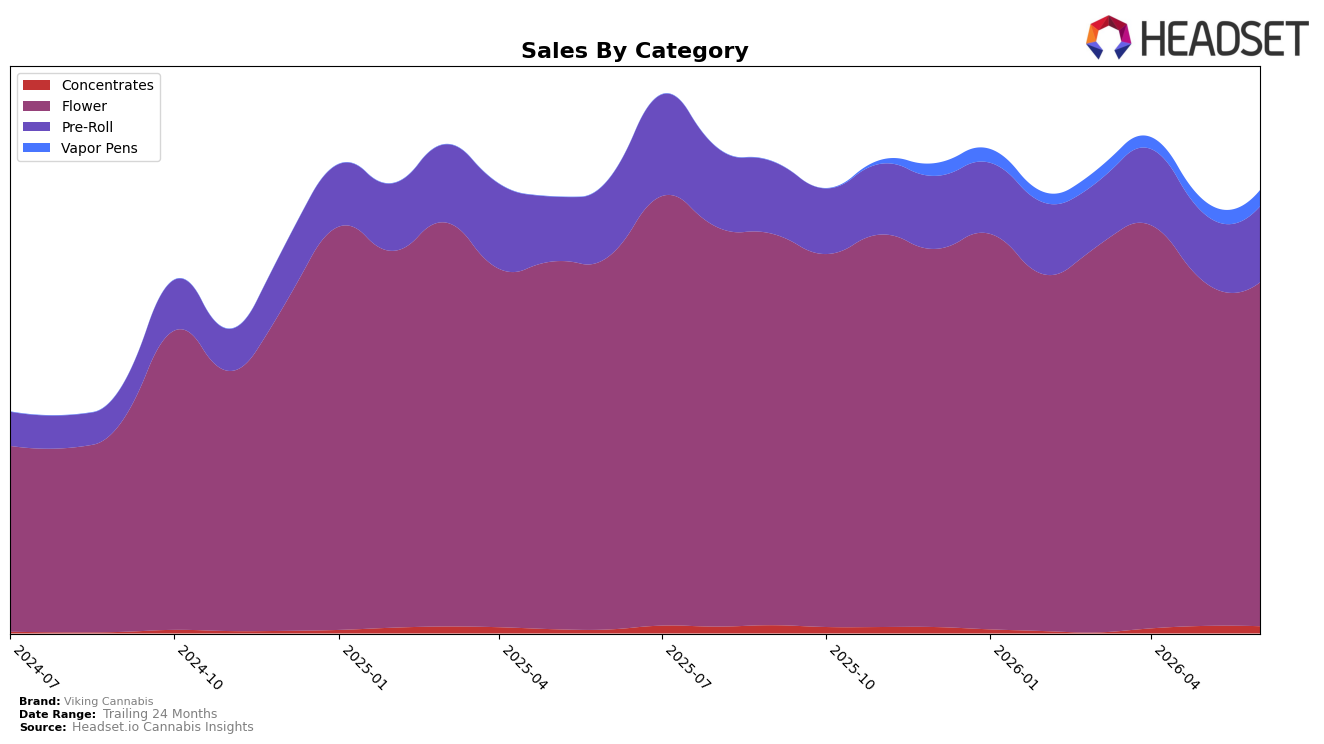
In June 2026, Viking Cannabis concentrated 77.74% of sales in Flower while holding rank 12 in Washington Flower, with category revenue down 7.75% year over year but up 0.04% month over month; that mix sat alongside a Pre-Roll share of 17.11% with sales down 1.39% year over year and up 11.71% month over month. Smaller lines provided volatility: Vapor Pens at 3.59% share posted a 24.35% month-over-month lift without a reported year-over-year baseline, and Concentrates at 1.55% share rose 90.87% year over year but slipped 4.12% month over month; this spread, combined with a 7.50% year-over-year increase in average price to one $19.83 price point, implies the brand is leaning on premiumized Flower while using faster-moving, lower-share formats to buffer short-term softness.
The mix shift suggests a positioning pivot toward Flower-first depth complemented by momentum skews in convenience formats: Pre-Rolls’ 11.71% month-over-month rise alongside Flower’s 0.04% tick indicates trial-driven or basket-building growth, while Vapor Pens’ 24.35% monthly gain against a 3.59% share points to early-stage traction rather than scale. With Concentrates expanding 90.87% year over year but contracting 4.12% month over month, and overall brand sales down 2.38% year over year despite a 116.77% 24‑month increase, the pattern implies the path to sustained rank improvement in rank 12 Flower relies on stabilizing Flower declines while converting the double-digit month-over-month lifts in Pre-Rolls and Vapor Pens into repeatable share accretion.
Competitive Landscape
Viking Cannabis sits at rank #12 in WA Flower in June 2026, sliding 2 positions year over year from #10 and 4 positions since March 2026 when it was #8; the brand also remains 5 spots below its peak of #7 from November 2025, indicating a multi-quarter retreat. In contrast, Lifted Cannabis Co climbed from #8 to #3 while growing sales 17.9% year over year, and Fifty Fold advanced from #9 to #4 with 22.3% year-over-year sales growth; meanwhile, Legends held #2 despite a 19.8% sales decline. The juxtaposition of a 2-rank YoY drop and a 5-position gap from peak, alongside competitors’ upward rank mobility and positive sales trends, implies Viking Cannabis is losing relative momentum in shelf position and buyer rotation unless it reclaims share drivers that previously supported its November 2025 peak.

Notable Products
Blockberry (3.5g) posted the steepest decline in June 2026 at -17.9% and slid to rank 10, while Oil Tanker (3.5g) jumped 21.9% to rank 2, indicating share is consolidating in two core strains at opposite trajectories. Candy Mac (3.5g) in rank 1 grew 6.5% month over month as Oil Tanker Hash Infused Pre-Roll 2-Pack (1g) climbed 25.7% to rank 5, and five of the top ten are Flower SKUs, concentrating sales in standard eighths rather than breadth across form factors. Old School Lemons (3.5g) was nearly flat at -0.3% in rank 7 while White Cherries (3.5g) in rank 8 rose 2.8%, and Pre-Roll entries at ranks 3, 4, 5, and 9 signal a secondary lane that is growing but still trails the leading Flower ranks; the pattern implies Viking Cannabis is leaning into a two-tier mix where flagship Flower anchors volume and a smaller set of infused Pre-Rolls provides incremental upside. The combination of a -17.9% pullback for Blockberry (3.5g) alongside a $28,446 month for Oil Tanker (3.5g) suggests pruning lower-velocity Flower while reinforcing winners could lift overall efficiency.
Top Selling Cannabis Brands
Data for this report comes from real-time sales reporting by participating cannabis retailers via their point-of-sale systems, which are linked up with Headset’s business intelligence software. Headset’s data is very reliable, as it comes digitally direct from our partner retailers. However, the potential does exist for misreporting in the instance of duplicates, incorrectly classified products, inaccurate entry of products into point-of-sale systems, or even simple human error at the point of purchase. Thus, there is a slight margin of error to consider. Brands listed on this page are ranked in the top twenty within the market and product category by total retail sales volume.

