Jun-2026
Sales
Trend
6-Month
Product Count
SKUs
Avg Price
YoY Sales Change
YoY Price Change
Market Insights Snapshot
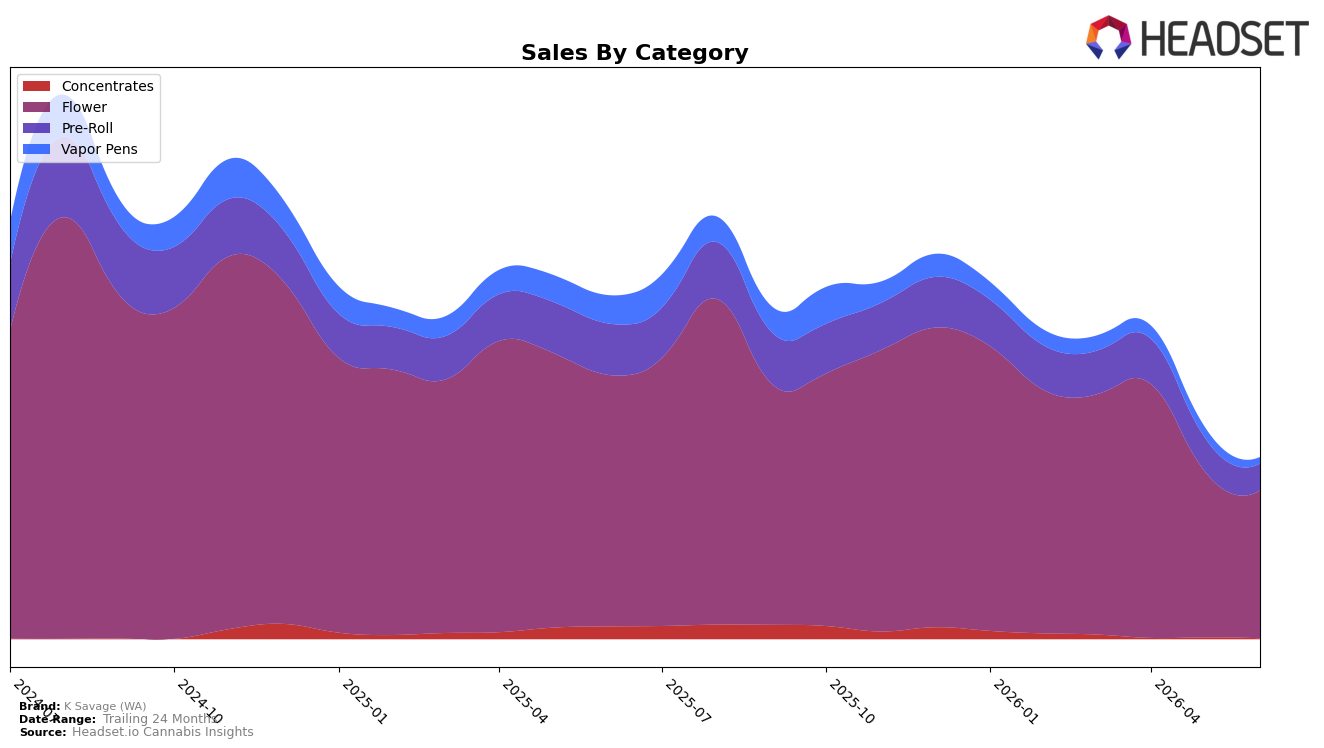
K Savage (WA) concentrated 80.98% of June 2026 sales in Flower, up 2.41 points from a 78.57% mix a year earlier as Vapor Pens fell to 3.62% and Concentrates to 0.58%. Flower declined 41.27% year over year and 11.16% month over month, while Pre-Roll dropped 47.44% YoY and 20.13% MoM; Vapor Pens contracted 76.70% YoY and 38.02% MoM. With average price down 5.12% YoY to $16.74 and Flower’s average price at $24.84 against Pre-Roll at $5.81, the mix shift toward Flower alongside double‑digit MoM declines implies volume loss is broad-based but revenue dependence is consolidating into a single category risk in Washington.
Holding a 28 rank in Washington Flower while brand sales are down 47.01% YoY and 61.34% over 24 months indicates K Savage (WA) is sliding in relevance even within its anchor category. The 2.41‑point mix gain in Flower coupled with a 20.13% MoM decline in Pre-Roll and a 38.02% MoM decline in Vapor Pens suggests portfolio narrowing rather than tactical reallocation, concentrating exposure where price compression and double‑digit category declines persist; the positioning implication is a need to re-balance toward formats with steadier MoM trajectories to reduce sensitivity to Flower volatility.
Competitive Landscape
K Savage (WA) sits at rank #28 in Washington Flower for June 2026, down 13 positions year over year from #15 and 12 spots below its March 2026 mark of #16, indicating a reversal from its peak of #8 in November 2024; meanwhile, Phat Panda held #1 with a 16.6% YoY sales increase as Legends stayed at #2 despite a 19.8% YoY decline, and Sweetwater Farms advanced to #5 with 65.8% YoY growth, underscoring that K Savage (WA)’s drop from #16 to #28 over the last three months coincides with competitors either consolidating at the top or accelerating, implying that the brand’s rank trajectory points to share loss in a market where upward mobility remains concentrated among faster-growing rivals.

Notable Products
Lantz (3.5g) posted the steepest decline in June 2026 at -23.4% and slipped to rank 9, while Blue Lobster (3.5g) fell -14.6% at rank 8, implying mid-tier Flower volatility is dragging momentum even as rank 4 Lilac Wine (3.5g) grew 10.5%. Angela Pre-Roll 2-Pack (1g) rose 27.4% to rank 1 and GMO Pre-Roll 2-Pack (1g) climbed 33.3% to rank 2, and four of the top ten are Pre-Roll SKUs, indicating format-led gains are concentrated at the top. Angela (3.5g) was nearly flat at -0.7% at rank 5 versus GMO (3.5g) at -0.4% at rank 6, while Lilac Wine Pre-Roll 2-Pack (1g) dipped -8.8% at rank 3 even as its Flower counterpart expanded, suggesting strain performance is diverging by format. The mix points to K Savage (WA) leaning into Pre-Rolls for near-term velocity while rationalizing weaker Flower positions rather than pushing uniform strain growth; the single largest ticket remains Lilac Wine (3.5g) at $24,485, reinforcing where pricing power likely resides.
Top Selling Cannabis Brands
Data for this report comes from real-time sales reporting by participating cannabis retailers via their point-of-sale systems, which are linked up with Headset’s business intelligence software. Headset’s data is very reliable, as it comes digitally direct from our partner retailers. However, the potential does exist for misreporting in the instance of duplicates, incorrectly classified products, inaccurate entry of products into point-of-sale systems, or even simple human error at the point of purchase. Thus, there is a slight margin of error to consider. Brands listed on this page are ranked in the top twenty within the market and product category by total retail sales volume.

