.svg)

Sep-2026
Sales
Trend
6-Month
Product Count
SKUs
Avg Price
YoY Sales Change
YoY Price Change


Where to Buy
WA Grower is stocked at 15 licensed dispensaries across Washington, with the deepest coverage in Vancouver, Longview, Seattle, Elma, and Lacey. Search by ZIP code or city below to find the closest one, or filter by product type if you are after a specific format.
Market Insights Snapshot
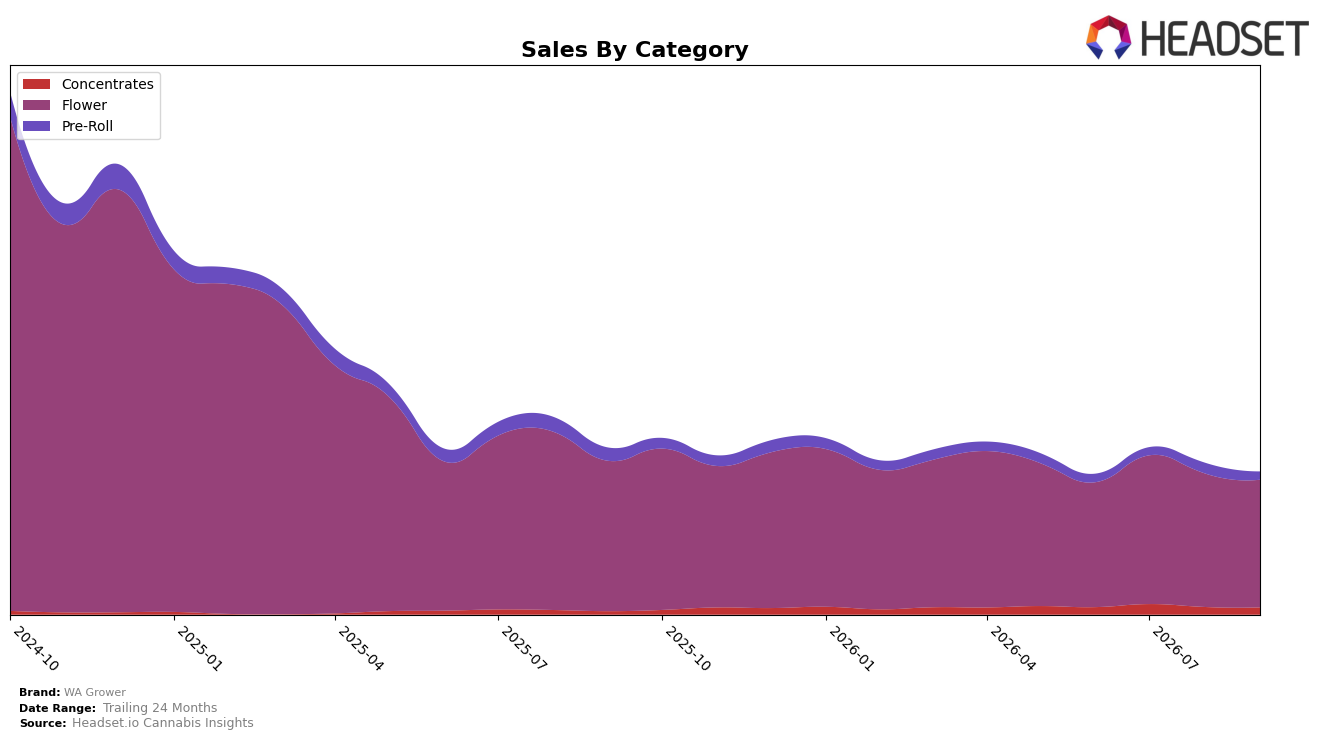
WA Grower’s category mix in September 2026 remained concentrated in Flower at 89.23% share, with Flower sales down 15.12% year over year and 4.49% month over month, while the brand’s overall sales declined 14.33% YoY and its average price rose 7.84%. Pre-Roll contracted to 5.72% share with a 37.93% YoY drop and a 22.98% MoM decline, contrasting with Concentrates at 5.05% share, which jumped 110.74% YoY despite a 5.29% MoM dip; within WA Flower specifically, the brand sat at rank 38. The pattern implies WA Grower is overexposed to a shrinking Flower base and underweight in the only high-growth pocket, Concentrates, creating a drag on total performance as monthly softness compounds.
With Flower still near nine-tenths of mix and down 15.12% YoY alongside a 4.49% MoM decline, the path to stabilizing share likely requires reallocating toward Concentrates, where triple-digit YoY growth coexists with a manageable 5.29% MoM pullback. The 7.84% YoY rise in average price against a brand-wide 14.33% YoY sales decline, combined with a 22.98% MoM fall in Pre-Roll, suggests price-sensitive segments are leaking volume while premium-leaning Flower is not offsetting unit losses; maintaining a Flower-heavy profile while holding rank 38 in Washington Flower implies the brand trades depth for fragility, and shifting 3–5 points of mix into Concentrates could convert category-level growth into steadier total sales.
Competitive Landscape
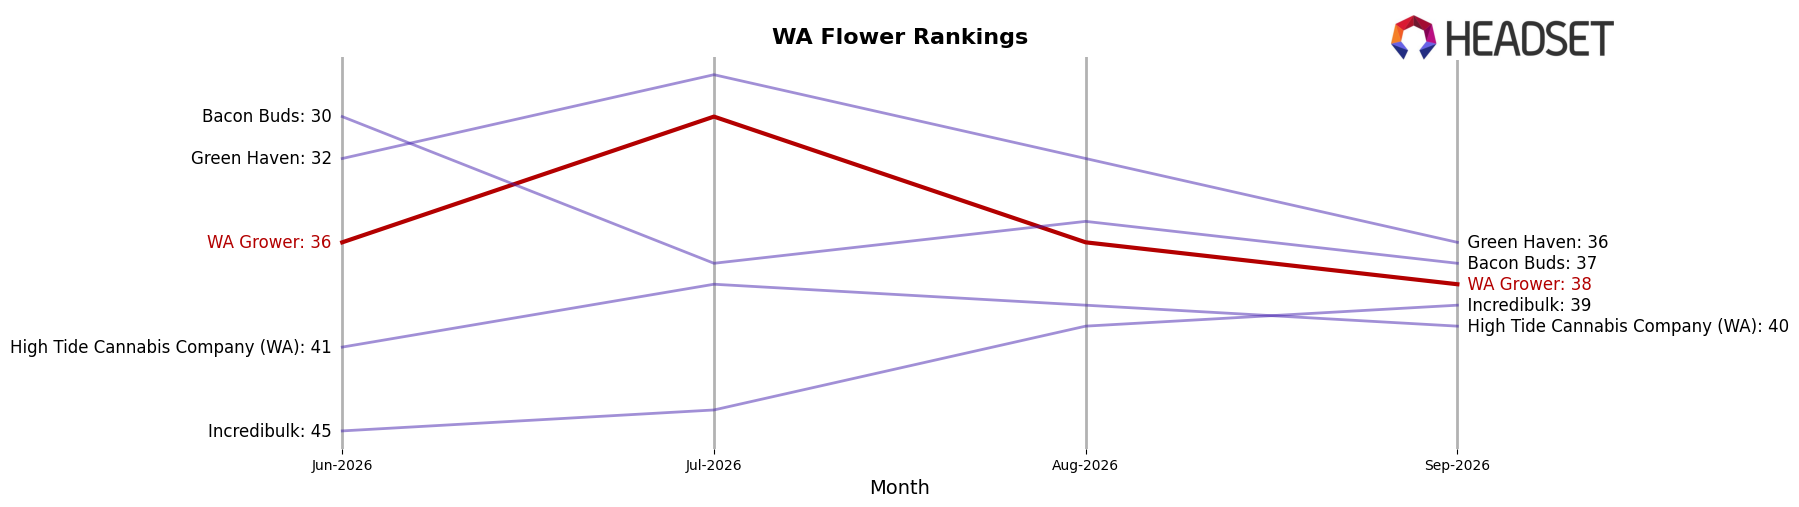
WA Grower sits at rank #38 in September 2026, down 9 places year over year from #29, and 2 spots below its June 2026 position of #36; the brand is also far from its peak rank of #6 in December 2024, indicating a multi-quarter slide. In contrast, Phat Panda holds #1 with an 18.99% year-over-year sales increase while Legends remains #2 despite a -16.90% decline, and Hemp Kings surged to #5 from #24 with 105.09% growth, collectively implying WA Grower is losing relative share as faster-moving rivals either defend or climb the leaderboard. The rank trajectory—down 9 positions year over year and slipping 2 ranks quarter-over-quarter—implies WA Grower must arrest ongoing share dilution to avoid further down-tiering within WA Flower.
Notable Products
Indica RSO (1g) posted the steepest movement in September 2026 with a -11.6% MoM decline, sliding to rank 2 while Alaskan Thunder Fuck Pre-Roll 2-Pack (1g) fell -44.2% to rank 7, indicating that non-flower formats lost momentum relative to Flower. Gorilla Glue #4 (3.5g) climbed 24.9% MoM to rank 1 and God's Gift (7g) jumped 30.9% to rank 4, while Gorilla Glue #4 (7g) rose 29.6% to rank 3; six of the top ten are Flower SKUs, pointing to category concentration. With Gorilla Glue variants spanning ranks 1 and 3 and a 14g format holding rank 9, the brand is anchoring demand in multi-size Flower rather than in Pre-Roll or Concentrates, despite a single SKU at $10,641 in the 14g segment. The pattern implies WA Grower is shifting commercial weight toward scalable Flower families and away from format experiments that are not retaining rank.
Top Selling Cannabis Brands






Data for this report comes from real-time sales reporting by participating cannabis retailers via their point-of-sale systems, which are linked up with Headset’s business intelligence software. Headset’s data is very reliable, as it comes digitally direct from our partner retailers. However, the potential does exist for misreporting in the instance of duplicates, incorrectly classified products, inaccurate entry of products into point-of-sale systems, or even simple human error at the point of purchase. Thus, there is a slight margin of error to consider. Brands listed on this page are ranked in the top twenty within the market and product category by total retail sales volume.

