.svg)


Where to Buy
Wave Edibles is stocked at 35 licensed dispensaries across Washington, with the deepest coverage in Vancouver, Tacoma, Seattle, Mount Vernon, and Spokane. Search by ZIP code or city below to find the closest one.
Market Insights Snapshot
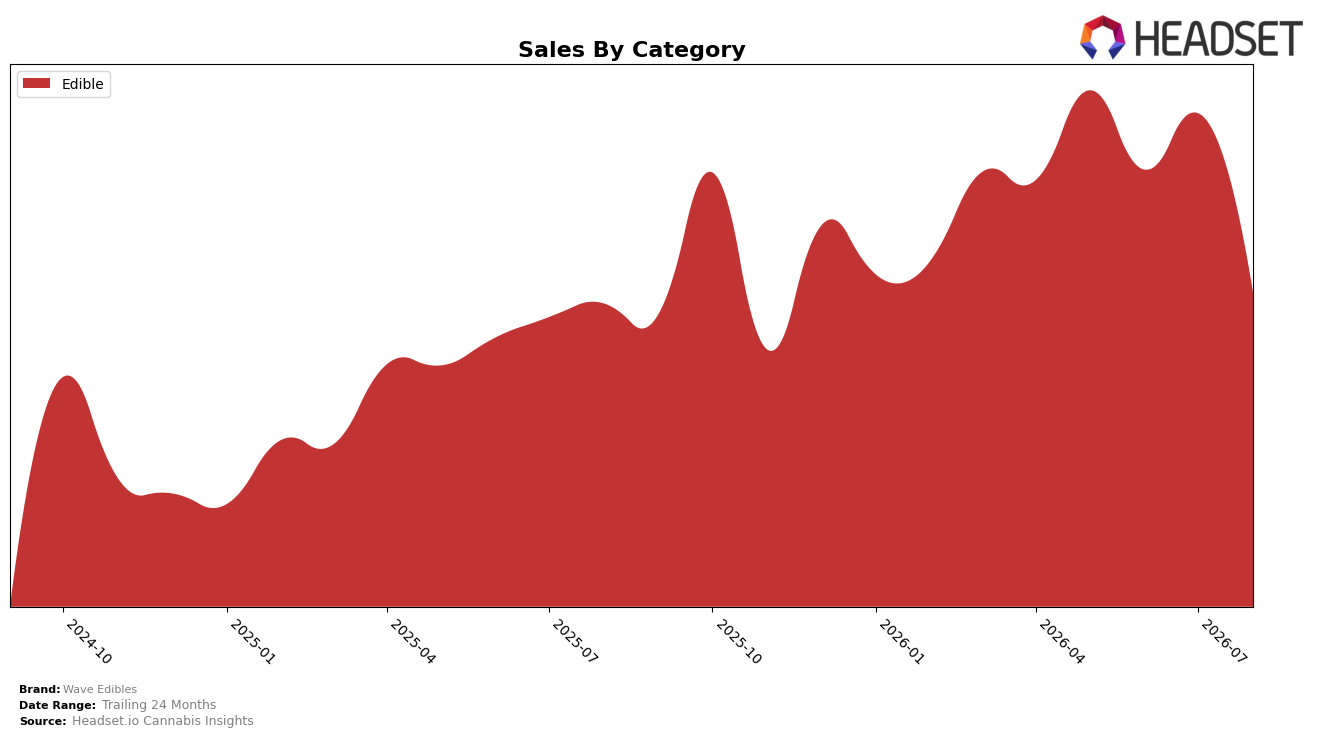
Wave Edibles operated as a single-category brand in August 2026, with Edible accounting for 100.0% of sales, posting a year-over-year change of 1.9% and a month-over-month decline of 23.8%. Average price moved 1.7% higher year over year while category sales fell 23.8% month over month, indicating mix stability but demand volatility within the same SKU set. In Washington Edible, the brand held rank 36, a fixed position that, combined with a 1.9% YoY sales gain and a 23.8% MoM pullback, implies a reliance on base-line repeat purchasing rather than promotional peaks, with pricing power absorbing some volume softness.
The concentration in a single Edible portfolio means Wave Edibles is trading consistency for exposure risk: a 100.0% mix in Edible and a 1.9% YoY lift alongside a 23.8% MoM dip suggests seasonality and promo timing drive short-term swings more than assortment breadth. With rank 36 in Washington Edible and a 1.7% YoY average price increase, the brand’s positioning skews toward value retention over volume chasing, which implies headroom to stabilize monthly variability through calendarized activation rather than expanding into adjacent categories.
Competitive Landscape
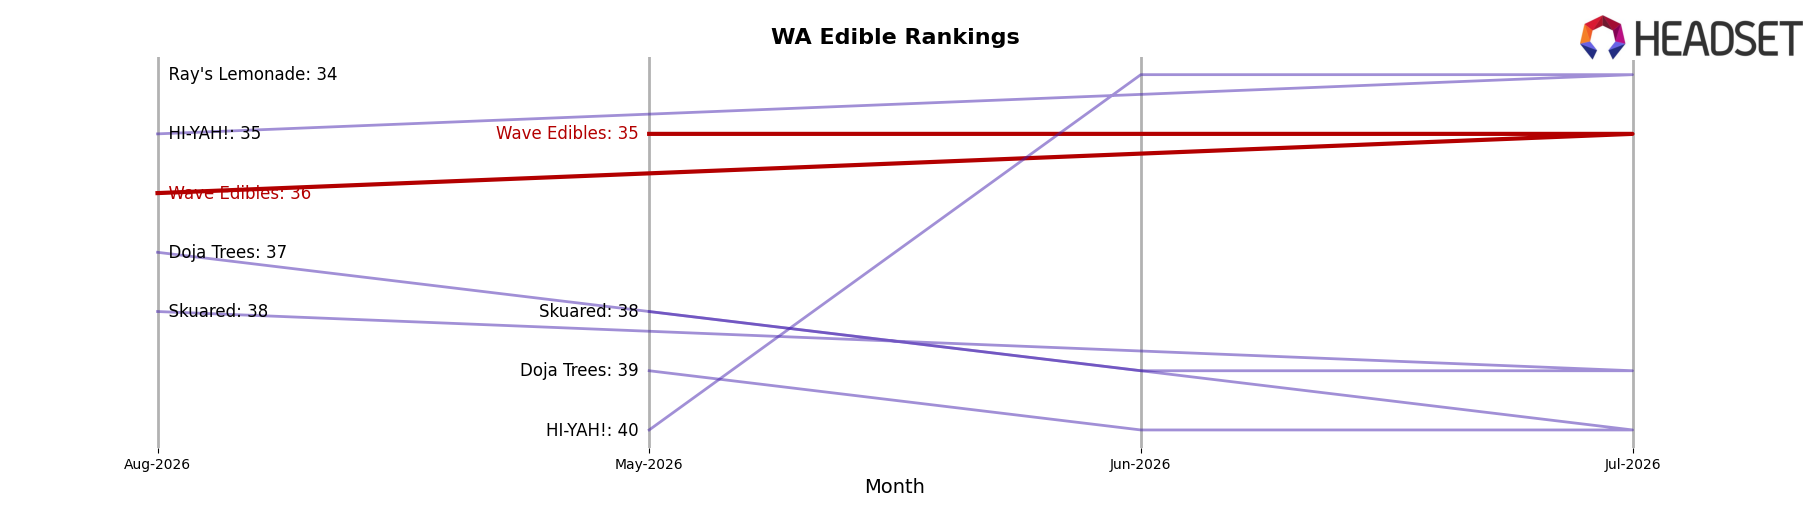
Wave Edibles sits at rank #36 in WA Edible in August 2026, a 2-position improvement from #38 year over year, but it slipped 1 spot from #35 in July 2026, its peak month, indicating recent momentum that hasn’t fully held. In contrast, Wyld held #1 both year over year and in August 2026 while growing sales by 5.1%, and Green Revolution stayed at #2 with a 7.0% sales decline, suggesting top-tier stability despite mixed growth signals. With Wave Edibles’ August 2026 position (#36) narrowly below its 3-month mark (#35) and only 1 rank off its peak, the pattern implies incremental gains year over year but a need to convert short-term rank volatility into sustained upward movement.
Notable Products
Sativa Blood Orange Dark Chocolate Poppers 10-Pack (100mg) posted the steepest decline in August 2026 at -65.4% MoM, sliding to a tie at rank 6, while Indica Peanut Butter Chocolate Swirls 10-Pack (100mg) fell -44.5% to rank 2; by contrast, Lil Salted Caramels 10-Pack (100mg) rose +30.3% to rank 3 and Salted Toffee Truffles Crunch Chocolate 10-Pack (100mg) inched up +5.9% at rank 1. With four of the top five showing double-digit drops of -13.3% to -65.4% and three SKUs clustered at rank 6, volatility is concentrating in mid-table positions even as the lead SKU holds steady with $2,966. The pattern implies Wave Edibles is over-indexed to chocolate formats that are bifurcating between a stable flagship and weakening secondary SKUs, suggesting a need to rebalance toward faster-recovering items like caramels.
Top Selling Cannabis Brands






Data for this report comes from real-time sales reporting by participating cannabis retailers via their point-of-sale systems, which are linked up with Headset’s business intelligence software. Headset’s data is very reliable, as it comes digitally direct from our partner retailers. However, the potential does exist for misreporting in the instance of duplicates, incorrectly classified products, inaccurate entry of products into point-of-sale systems, or even simple human error at the point of purchase. Thus, there is a slight margin of error to consider. Brands listed on this page are ranked in the top twenty within the market and product category by total retail sales volume.

