.svg)


Where to Buy
Yamba Junk is stocked at 67 licensed dispensaries across Oregon, with the deepest coverage in Portland, Bend, Medford, Salem, and Ashland. Search by ZIP code or city below to find the closest one.
Market Insights Snapshot
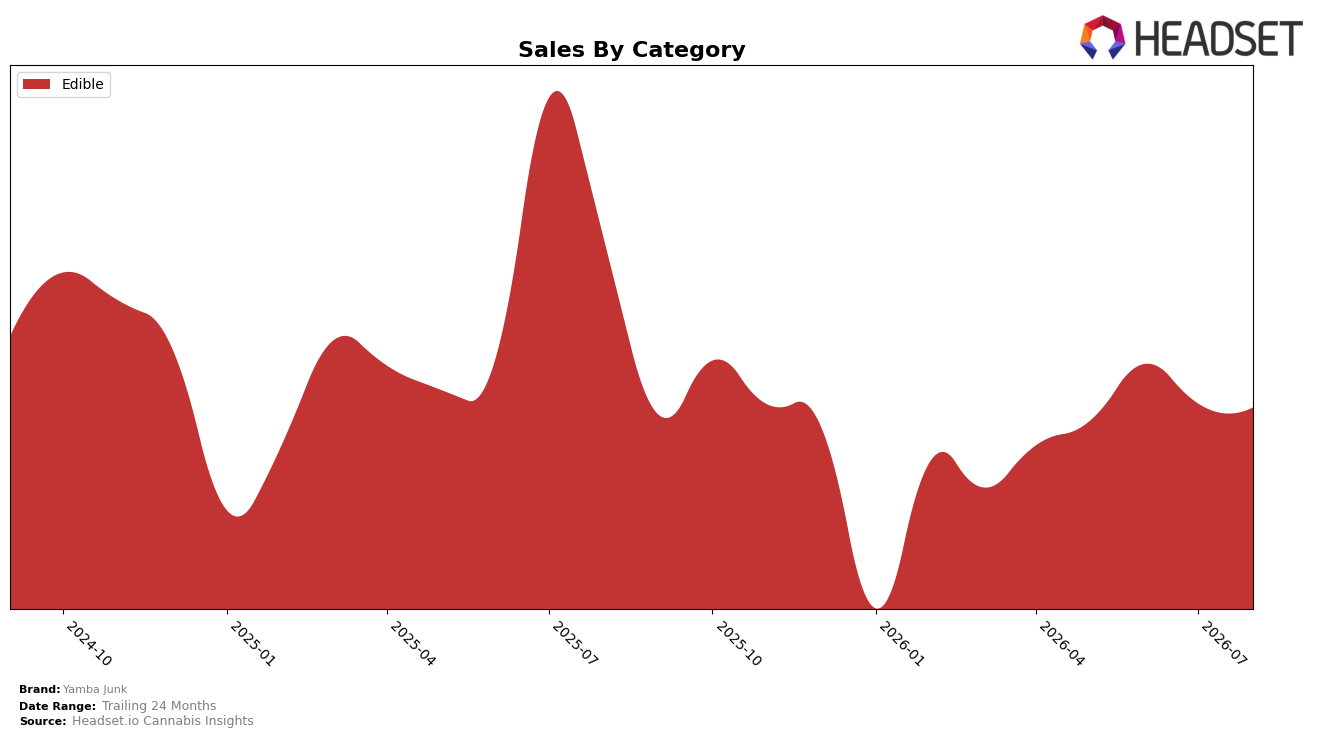
In August 2026, Yamba Junk operated as a single-category brand with Edible holding 100.0% share, while category sales declined 32.9% year over year and 1.2% month over month; average price contracted 6.7% YoY alongside a 100.0% category concentration, and rank in Oregon Edible settled at 31. This combination implies a concentrated footprint where price cuts have not offset volume drag, placing Yamba Junk at rank 31 with little buffer against further share loss if Edible softness persists.
The shift toward lower average price alongside a 32.9% YoY revenue drop and a 1.2% MoM dip suggests discounting is chasing demand rather than expanding it, while a 100.0% reliance on Edible limits cross-category trial that could stabilize rank 31 in Oregon. The pattern implies Yamba Junk’s positioning skews toward value-seeking Edible buyers, and without diversification or a price-pack architecture that lifts unit velocity, the brand risks further rank compression as category tides move against a single-format strategy.
Competitive Landscape
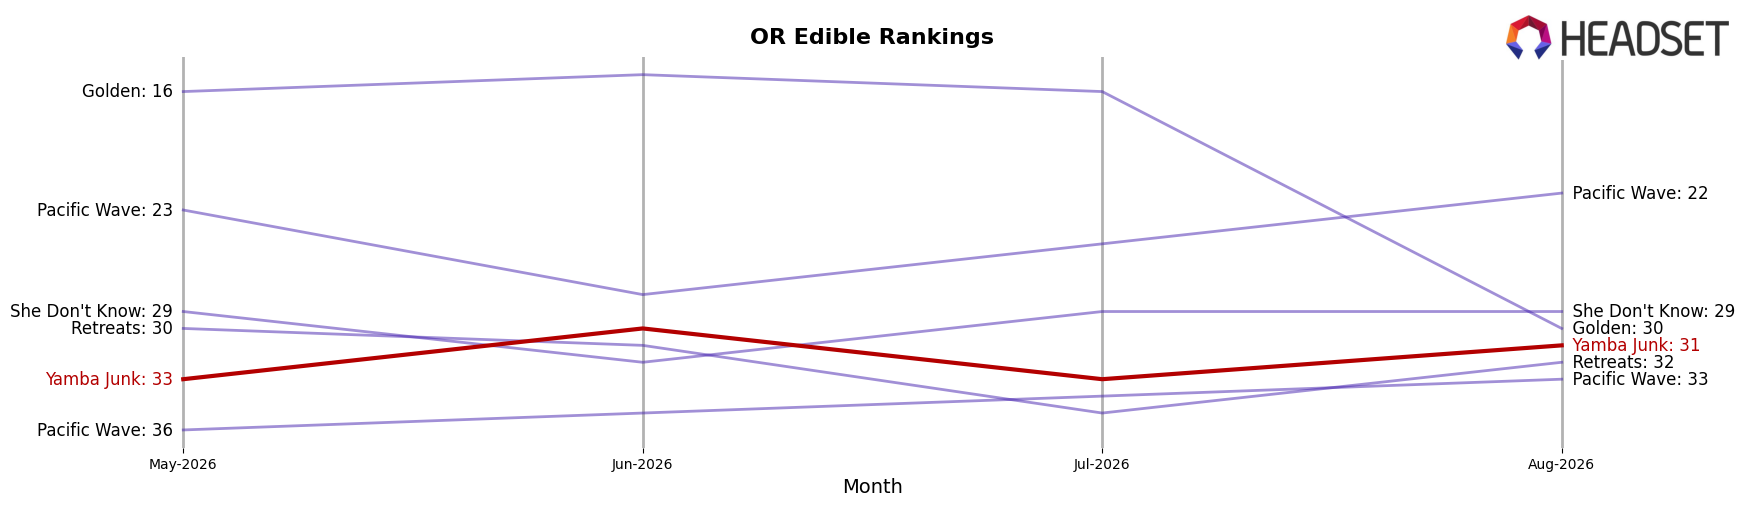
Yamba Junk sits at rank #31 in Oregon Edible for August 2026, sliding 4 spots year over year from #27 while improving 2 positions since May 2026 when it was #33; against this backdrop, category leaders like Wyld held #1 with a -1.5% year-over-year sales change and Mule Extracts maintained #5 with a +2.8% year-over-year increase, indicating that Yamba Junk’s downward YoY rank shift contrasts with stability or gains among top competitors. Although Yamba Junk’s current #31 is 7 places below its July 2025 peak at #24 and 4 places below its August 2025 level at #27, the 2-position climb from #33 to #31 over the last three months suggests short-term momentum even as year-over-year relative position erodes; taken together, this trajectory implies Yamba Junk is stabilizing quarter-on-quarter but losing share on an annual basis and must convert recent incremental gains into sustained rank recovery.
Notable Products
Variety Floss Cotton Candy (100mg) posted the standout movement in August 2026 with a 152.3% month-over-month surge while climbing into a shared rank of 5, outpacing the 134.7% gain from Green Apple Watermelon Floss Cotton Candy (100mg) at rank 6 and contrasting with the 72.4% rise of Lemon x Lime Floss Cotton Candy (100mg) at rank 1. Four of the top ten are Floss Cotton Candy SKUs and three are Sugadoobs, and the polarization is clear as Green Apple Watermelon Sugardoobs (100mg) dropped 15.3% at rank 2 while Strawberry Blueberry Sugadoob (100mg) fell 78.5% at a shared rank of 7. Lemon x Lime Floss Cotton Candy (100mg) led dollar volume at $5,507 alongside its 72.4% MoM increase, while Mystery Floss Cotton Candy (100mg) declined 39.6% at rank 5, signaling a reshuffle within flavors rather than a category exit. The pattern implies Yamba Junk is consolidating demand into Floss Cotton Candy variants with rapid flavor substitutions, suggesting assortment decisions should prioritize winning cotton-candy profiles over sustaining weaker Sugadoobs.
Top Selling Cannabis Brands






Data for this report comes from real-time sales reporting by participating cannabis retailers via their point-of-sale systems, which are linked up with Headset’s business intelligence software. Headset’s data is very reliable, as it comes digitally direct from our partner retailers. However, the potential does exist for misreporting in the instance of duplicates, incorrectly classified products, inaccurate entry of products into point-of-sale systems, or even simple human error at the point of purchase. Thus, there is a slight margin of error to consider. Brands listed on this page are ranked in the top twenty within the market and product category by total retail sales volume.

