Jun-2026
Sales
Trend
6-Month
Product Count
SKUs
Avg Price
YoY Sales Change
YoY Price Change
Market Insights Snapshot
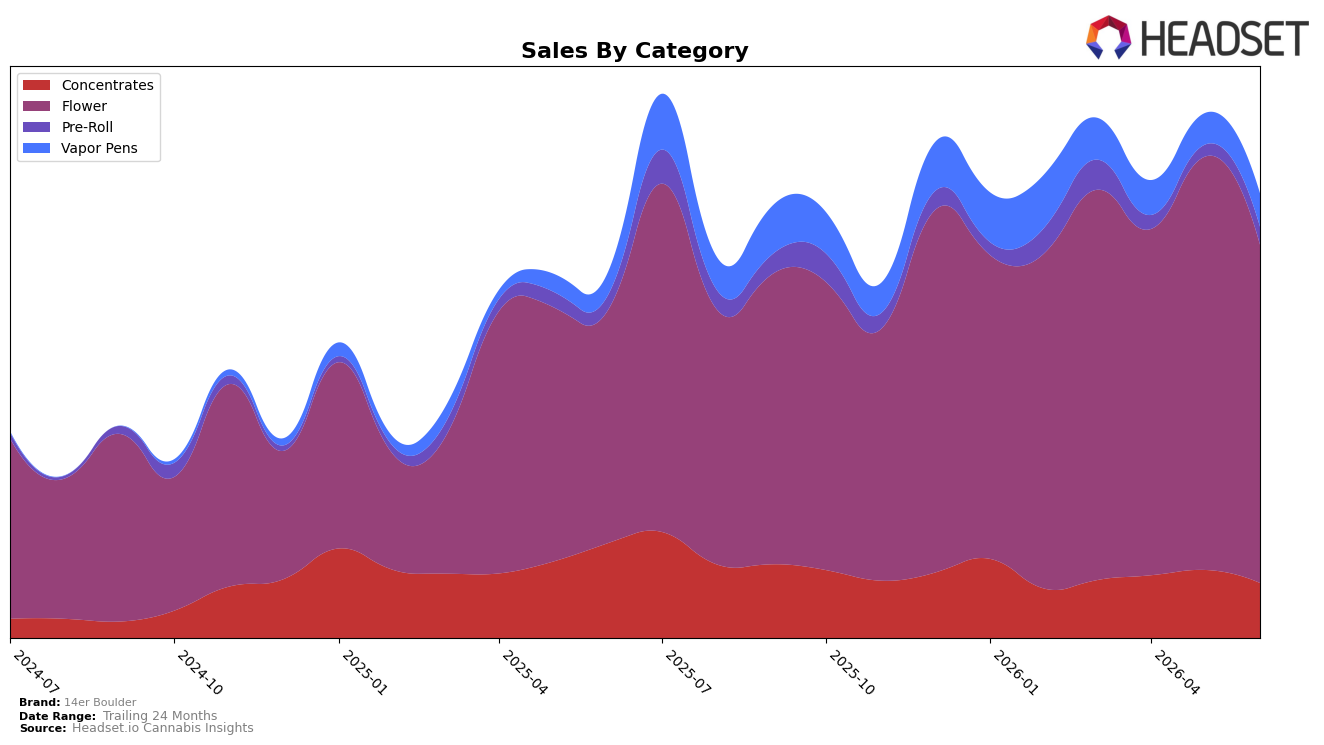
In June 2026, 14er Boulder concentrated 75.60% of sales in Flower with year-over-year growth of 44.83% but a month-over-month decline of 18.08%, while Concentrates held 12.51% share with a 41.57% YoY drop and an 18.84% MoM slide. Vapor Pens accounted for 7.66% share with 42.66% YoY growth and a 5.43% MoM lift, and Pre-Roll reached 4.23% share with 17.95% YoY growth and a 46.37% MoM spike; the brand’s Flower rank was 11 in Colorado. With overall average price down 18.80% YoY to one SKU-weighted average around $21.19, the mix indicates a volume-led Flower engine propping up annual gains while near-term momentum is rotating toward Pre-Roll and Vapor Pens.
The simultaneous 18.08% MoM contraction in Flower and 46.37% MoM surge in Pre-Roll suggest a shift toward lower-ticket trial and convenience formats, while Vapor Pens’ 5.43% MoM rise alongside a 42.66% YoY increase points to incremental penetration in inhalable alternatives. Given the 41.57% YoY pullback in Concentrates and its 12.51% share, the portfolio risk skews toward over-reliance on Flower at an 11th place category rank in Colorado, implying that sustaining June 2026 growth depends on converting Pre-Roll and Vapor Pens’ recent momentum into durable share while stabilizing Flower’s month-over-month slide.
Competitive Landscape
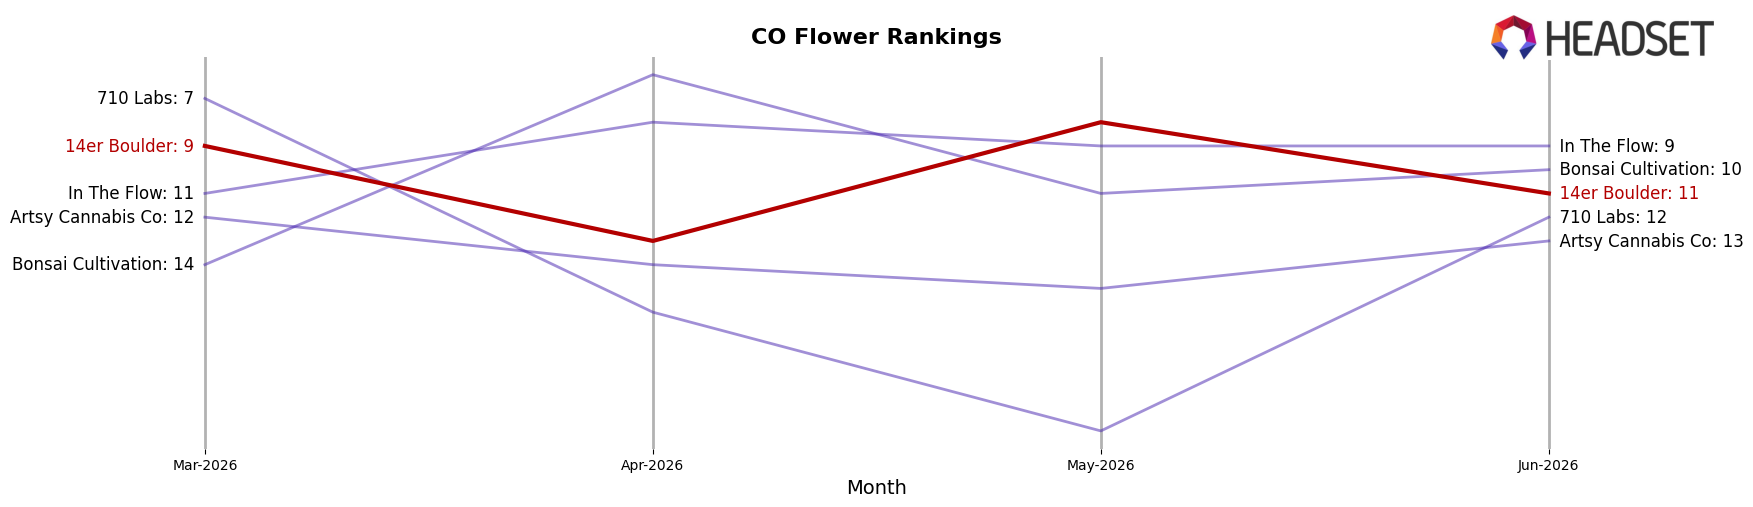
14er Boulder sits at rank #11 in CO Flower for June 2026, improving 5 places from #16 year over year, but slipping 2 positions from #9 three months ago while coming off a peak of #8 in May 2026; meanwhile, Seed & Strain Cannabis Co. climbed from #2 to #1 and Good Chemistry Nurseries fell from #1 to #3 with a -2.8% YoY sales change, indicating 14er Boulder’s rank trajectory is stabilizing mid-tier as faster-rising leaders compress the top slots.
Notable Products
Mellow Dawg (3.5g) set the tone in June 2026 with a -16.3% month-over-month slide and a tie at rank 5, signaling a pullback within the mid-pack even as Island Sweet Skunk (3.5g) jumped 39.4% MoM and reached rank 6. Blackberry Banana Kush (3.5g) held rank 1 while Jelly Pie (3.5g) sat at rank 5, and four of the top ten are Flower SKUs, indicating a category concentration that favors inhalables over Pre-Roll at rank 9. Sugarloaf Kush (3.5g) was effectively flat at -0.5% MoM while Hawaiian Goat (Bulk) occupied rank 2, leaving the assortment anchored by premium Flower rather than smaller-format experiments. The pattern implies 14er Boulder is leaning into larger-pack and 3.5g Flower dominance, so mix optimization should prioritize defending rank 1–2 winners while addressing mid-tier volatility exposed by Mellow Dawg’s double-digit decline.
Top Selling Cannabis Brands
Data for this report comes from real-time sales reporting by participating cannabis retailers via their point-of-sale systems, which are linked up with Headset’s business intelligence software. Headset’s data is very reliable, as it comes digitally direct from our partner retailers. However, the potential does exist for misreporting in the instance of duplicates, incorrectly classified products, inaccurate entry of products into point-of-sale systems, or even simple human error at the point of purchase. Thus, there is a slight margin of error to consider. Brands listed on this page are ranked in the top twenty within the market and product category by total retail sales volume.

