.svg)


Where to Buy
7 Wonders is stocked at 30 licensed dispensaries across Washington, with the deepest coverage in Tacoma, Everett, Seattle, Spokane, and Bremerton. Search by ZIP code or city below to find the closest one.
Market Insights Snapshot
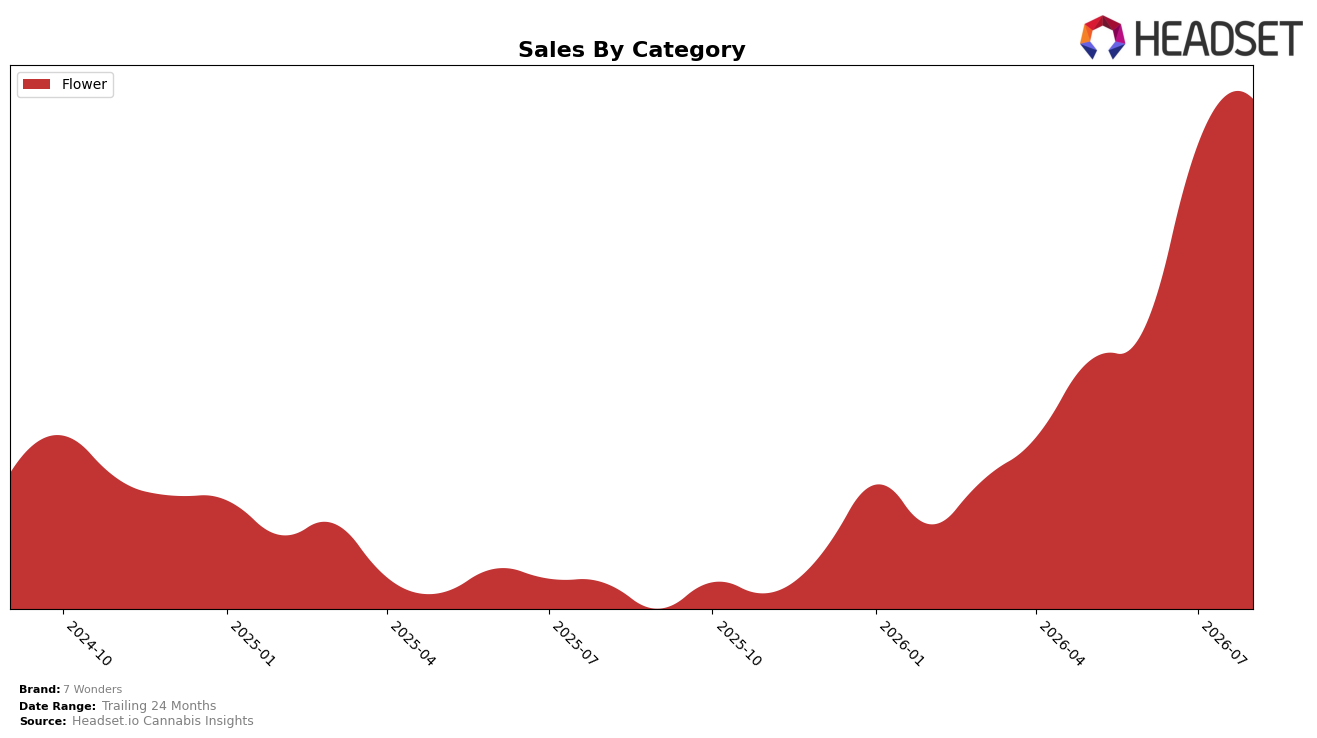
In August 2026, 7 Wonders operated as a single-category brand with Flower at 100.0% mix, posting year-over-year sales growth of 186.1% alongside month-over-month growth of 6.5%. Average price fell 20.4% YoY to $22.56 while Flower maintained a 100.0% share, indicating volume expansion outpacing price compression. Within Washington Flower, the brand sat at rank 23, and the combination of a 6.5% MoM lift and a 186.1% YoY surge suggests trading up in unit throughput despite lower price points; the pattern implies a volume-led strategy that leans on a concentrated Flower footprint to climb from rank 23 toward mid-tier territory.
The all-in Flower reliance at 100.0% share, paired with a 20.4% YoY price decline and a 6.5% MoM gain, implies the brand is prioritizing unit velocity over margin, seeking scale in Washington where it holds rank 23. A 186.1% YoY sales increase concentrated in one category reduces diversification risk coverage but amplifies buyer recognition within Flower, signaling that near-term positioning hinges on sustaining conversion at lower prices; the pattern implies that maintaining sub-$23 pricing while defending rank 23 could convert the 6.5% MoM momentum into durable shelf presence as long as the 186.1% YoY volume tailwind persists.
Competitive Landscape
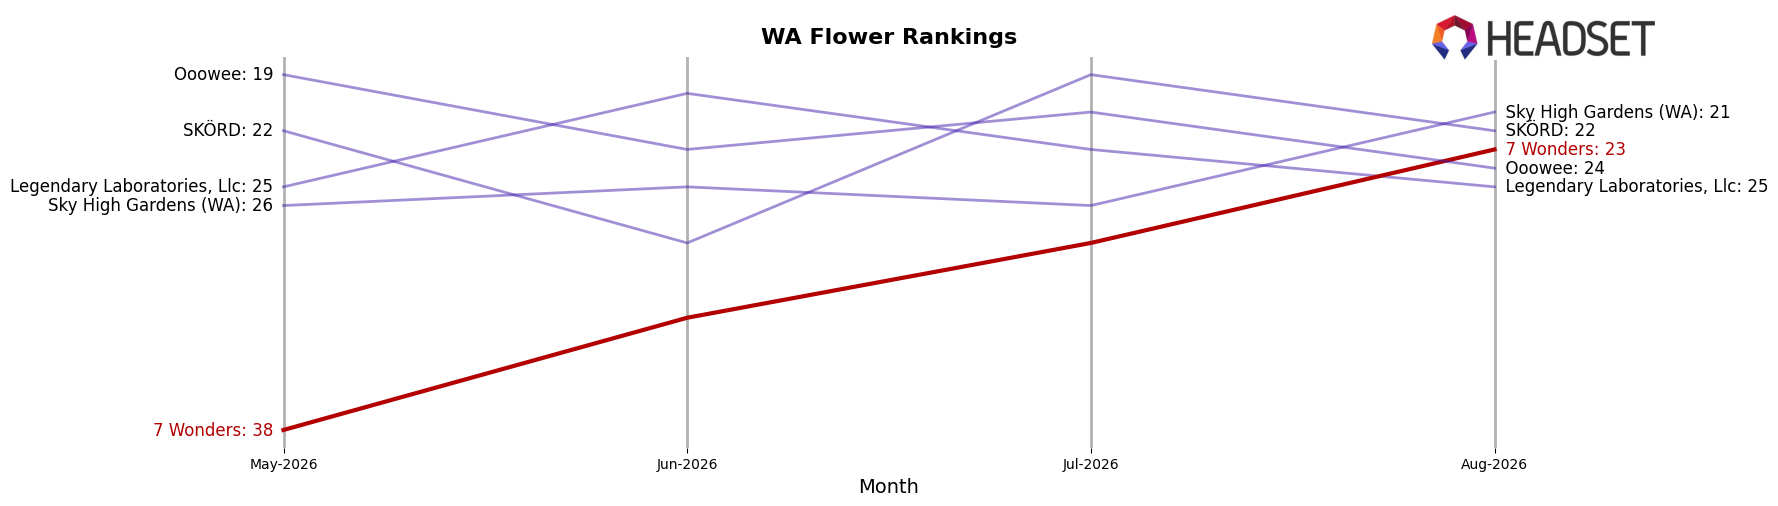
7 Wonders is ranked #23 in WA Flower in August 2026, up 48 positions year over year from #71, and 15 places since May 2026 from #38, marking its peak rank to date at #23 in August 2026; by contrast, Phat Panda held #1 both year over year and in August 2026 with a 23.7% YoY sales increase, while EZ Flower / EZ Puff / EZ-Joint slid from #3 YoY rank to #5 current with a -17.7% YoY sales change. The combination of a 48-rank annual climb and a 15-rank lift over three months, alongside top-tier rivals either consolidating at #1 or retreating by two positions, implies 7 Wonders is converting distribution or assortment gains into sustained share capture rather than a one-month spike.
Notable Products
Blue Candy (3.5g) posted the steepest change in August 2026 with a -16.4% MoM drop that pushed it to rank 4, while Candy Gas (7g) climbed 31.6% to rank 3 and Candy Gas (3.5g) rose 19.3% to hold rank 1. KM x Gelato (3.5g) advanced 28.7% to rank 2, and Gelato 69 (3.5g) increased 24.0% at rank 5, concentrating power at the top where five of the top ten are Flower SKUs in the 3.5g size. Only one SKU recorded a decline over -10% as Lemon Cherry Gelato (3.5g) slipped a milder -4.9% at rank 10, signaling that momentum is broadening beyond a single hero line despite Blue Candy’s setback. This mix implies 7 Wonders is tilting toward premium 3.5g Flower variants with expanding Gelato-family depth while selectively scaling multi-size anchors like Candy Gas, a posture that favors velocity over experimentation even as price-sensitive pockets remain.
Top Selling Cannabis Brands






Data for this report comes from real-time sales reporting by participating cannabis retailers via their point-of-sale systems, which are linked up with Headset’s business intelligence software. Headset’s data is very reliable, as it comes digitally direct from our partner retailers. However, the potential does exist for misreporting in the instance of duplicates, incorrectly classified products, inaccurate entry of products into point-of-sale systems, or even simple human error at the point of purchase. Thus, there is a slight margin of error to consider. Brands listed on this page are ranked in the top twenty within the market and product category by total retail sales volume.

