May-2026
Sales
Trend
6-Month
Product Count
SKUs
Avg Price
YoY Sales Change
YoY Price Change
Market Insights Snapshot
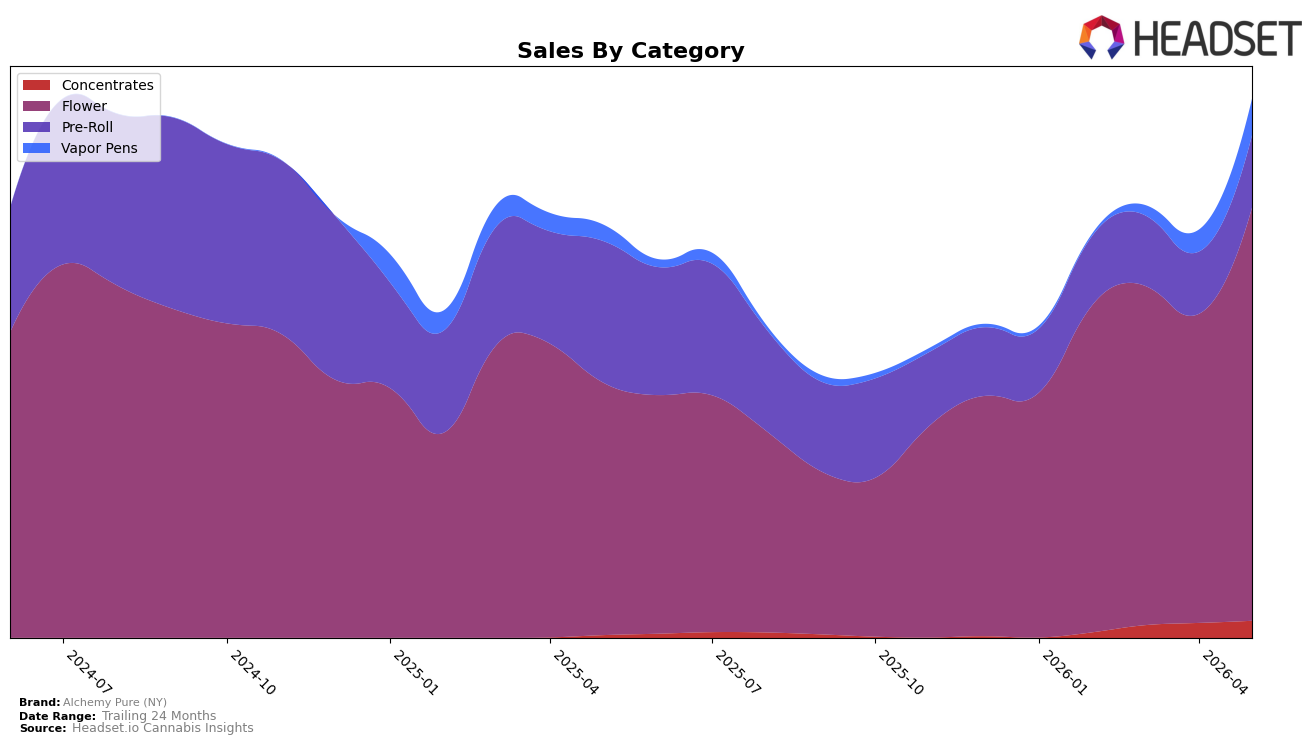
In May 2026, Alchemy Pure (NY) concentrated 76.70% of sales in Flower, where sales rose 63.77% year over year and 33.72% month over month, while Pre-Roll accounted for 13.40% with a 48.96% YoY decline but a 16.52% MoM lift. Vapor Pens held 6.73% share with 125.08% YoY and 67.65% MoM growth, and Concentrates at 3.17% posted 527.46% YoY and 14.33% MoM growth; the average price moved up 9.98% YoY to $50.51. The pattern indicates a pivot toward higher-growth inhalables beyond Flower, even as the brand’s NY mix remains Flower-heavy, implying near-term upside from category diversification alongside reliance on a single anchor.
With a Flower rank of 29 in New York and 76.70% category concentration, the 63.77% YoY Flower expansion and 33.72% MoM lift suggest defensible core scale, while the 125.08% YoY surge in Vapor Pens and 527.46% YoY rise in Concentrates point to an entry path into faster-growth niches. The 48.96% YoY contraction in Pre-Roll coupled with a 16.52% MoM uptick implies recent stabilization, and the 9.98% YoY average price increase signals pricing power that could support a premium positioning if Vapor Pens and Concentrates continue to outpace Flower in share gains.
Competitive Landscape
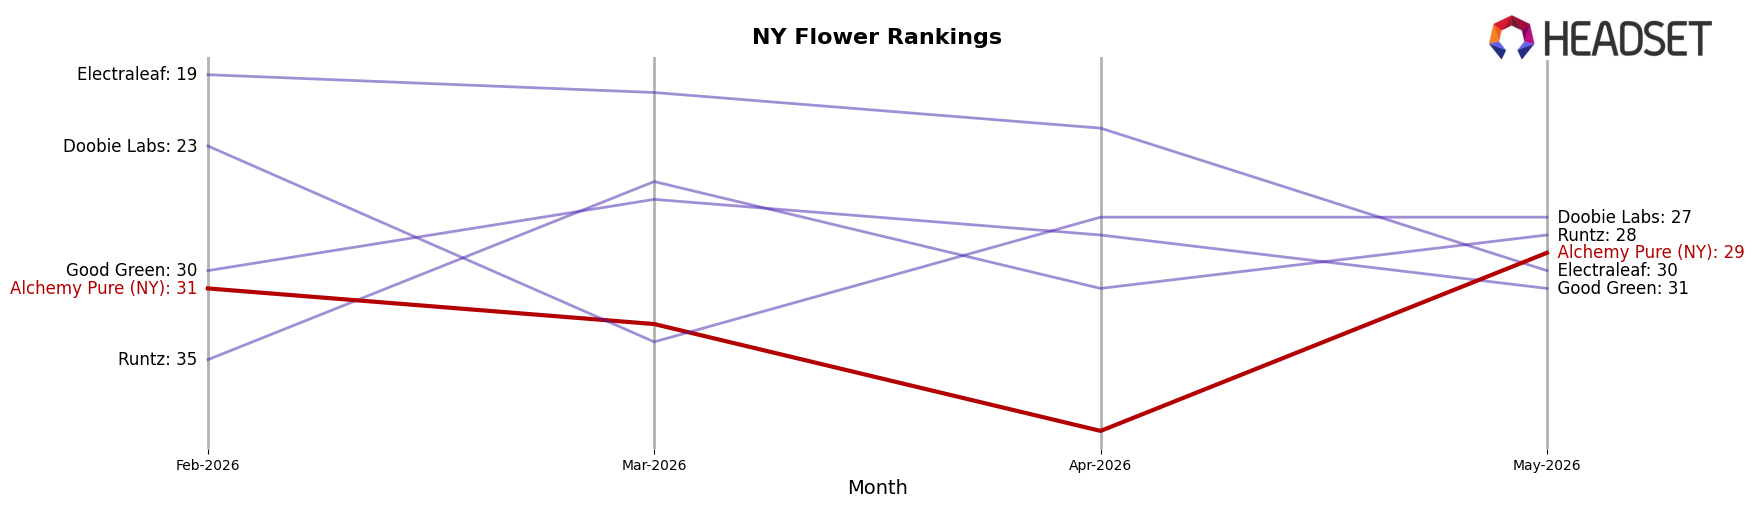
Alchemy Pure (NY) sits at rank #29 in NY Flower for May 2026, up 10 positions from #39 year over year, though it slipped 2 spots from #31 in February 2026 and remains 11 places below its peak at #18 in July 2024; meanwhile, Leal climbed from #11 to #1 and RYTHM advanced from #10 to #4, indicating that leaders are gaining ground faster than mid-pack movers. With Dank. By Definition dropping from #1 to #2 amid a 38.1% YoY sales decline while Rolling Green Cannabis eased from #2 to #3 and Untitled improved from #6 to #5, Alchemy Pure (NY)’s YoY rank rise alongside a recent 2-position quarterly dip points to incremental share recovery without momentum sufficient to close the gap to the accelerating top tier.
Notable Products
GMO Pre-Roll (0.5g) posted the standout move in May 2026 with a +118% month-over-month surge, jumping to rank 2, while Moonlight (3.5g) fell -29% to rank 7 and King Kong Kief Infused Pre-Roll 5-Pack (2.5g) slid -14% to rank 10. Catskill Blue Dream (3.5g) rose +17% and held rank 1, and three of the top ten are Flower SKUs, indicating concentration in core eighths and bulk formats even as Pre-Roll volatility reshapes the runner-up tier. One SKU exceeded $70,000 in sales, but the sharper swings are concentrated in smaller-format Pre-Rolls where rank mobility is highest. The mix implies Alchemy Pure (NY) is leaning on stable Flower leaders to anchor share while using Pre-Rolls as a tactical growth and trial engine despite greater month-to-month risk.
Top Selling Cannabis Brands
Data for this report comes from real-time sales reporting by participating cannabis retailers via their point-of-sale systems, which are linked up with Headset’s business intelligence software. Headset’s data is very reliable, as it comes digitally direct from our partner retailers. However, the potential does exist for misreporting in the instance of duplicates, incorrectly classified products, inaccurate entry of products into point-of-sale systems, or even simple human error at the point of purchase. Thus, there is a slight margin of error to consider. Brands listed on this page are ranked in the top twenty within the market and product category by total retail sales volume.

