.svg)

Sep-2026
Sales
Trend
6-Month
Product Count
SKUs
Avg Price
YoY Sales Change
YoY Price Change


Where to Buy
Hudson Cannabis is stocked at 202 licensed dispensaries across New York, with the deepest coverage in New York, Brooklyn, Queens, Rochester, and Syracuse. Search by ZIP code or city below to find the closest one, or filter by product type if you are after a specific format.
Market Insights Snapshot
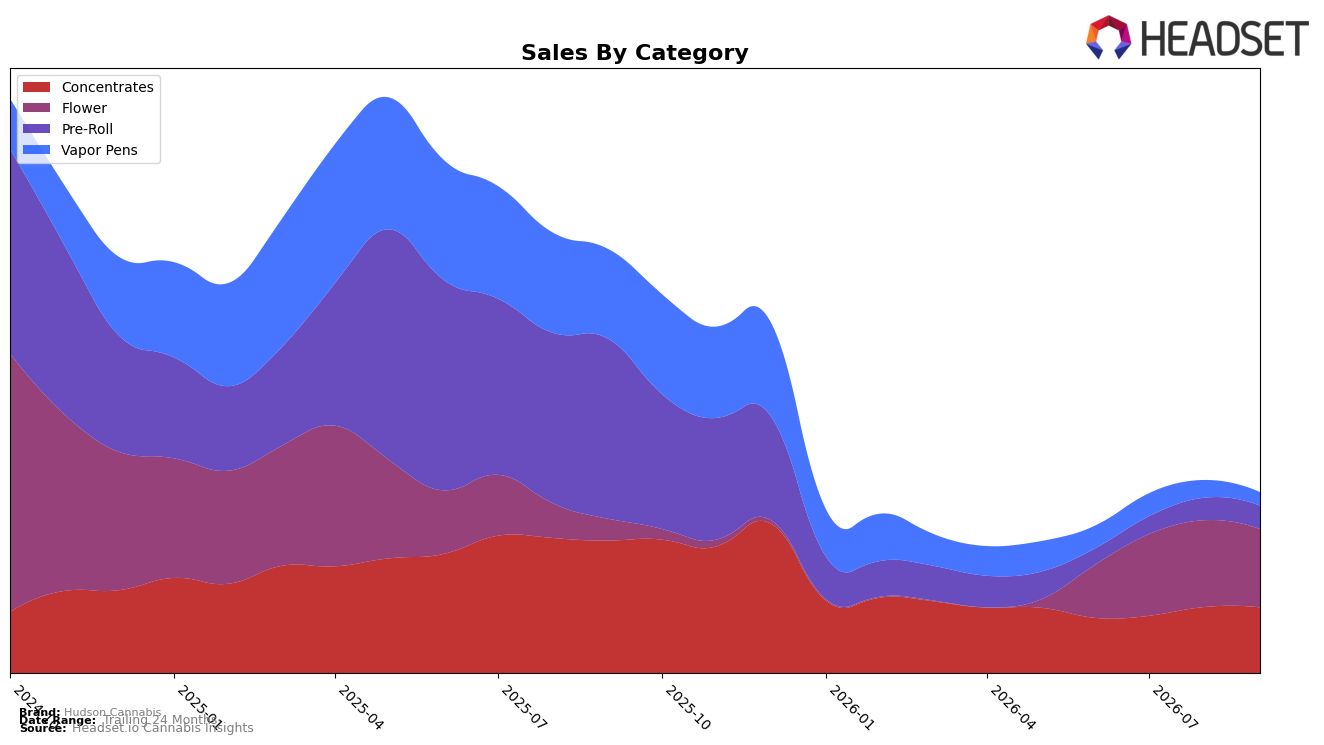
In September 2026, Hudson Cannabis concentrated 43.21% of sales in Flower and 36.40% in Concentrates, while Pre-Roll and Vapor Pens accounted for 12.88% and 7.51% respectively, signaling a mix led by inhalable formats. Flower grew 260.27% year over year but slipped 9.79% month over month, whereas Concentrates fell 50.32% year over year with a milder 0.53% month-over-month decline; at the same time, Pre-Roll contracted 87.03% year over year but inched up 3.66% month over month, and Vapor Pens dropped 84.86% year over year with a 23.06% month-over-month pullback. Despite a 104.24% year-over-year increase in average price to $63.64 and a 57.30% brand-level sales decline year over year, the category mix indicates reliance on Flower to offset steep declines in smaller segments, implying a pivot toward higher-priced core offerings within New York.
The mix shift elevates Hudson Cannabis’s positioning around Flower even as the brand sits at rank 56 in New York Flower, with the 260.27% Flower growth contrasted against an 84.86% decline in Vapor Pens and an 87.03% decline in Pre-Roll, signaling differentiation anchored in whole-flower formats rather than disposable or value-led segments. The 9.79% month-over-month dip in Flower alongside a 23.06% Vapor Pen contraction suggests price-sensitive demand pressure, while the 3.66% Pre-Roll month-over-month uptick from a reduced base implies experimentation at the edge of the portfolio; together with a 0.53% month-over-month slide in Concentrates, this pattern implies that defending share likely requires refining price tiers within Flower and selectively rebuilding complementary formats to stabilize rank and share.
Competitive Landscape
Hudson Cannabis sits at rank #56 in NY Flower for September 2026, improving 61 positions year over year from #117 and advancing 19 spots since June 2026 from #75; both shifts contrast with its earlier peak of #11 in September 2024, marking a long slide followed by a recent rebound. Meanwhile, Find. moved from #5 to #1 and Grassroots climbed from #15 to #2 alongside a 150.3% YoY sales increase, indicating that top-tier share is consolidating above Hudson Cannabis even as it rises from the lower tier. The pattern implies that Hudson Cannabis’s upward rank trajectory is recovery-oriented—gaining ground quickly off a low base—but will require step-changes to re-enter the top 20 where competition has accelerated.

Notable Products
Garlic Bomb Hash (1g) posted the steepest pullback at -27.6% MoM and slipped to a tie at rank 3, while Sour Haze Hash (1g) fell -18.7% to rank 2, indicating pressure within Concentrates even as Hudson Sour Hash Coin (1g) held rank 1 with a milder -7.9% dip; this tilt suggests demand consolidated at the category leader rather than broadening across SKUs. In Flower, Lemon OG Haze (28g) plunged -49.8% to rank 8 and Iced Sangria (28g) declined -23.1% to rank 9, whereas Farmer's Blend RSO Applicator (1g) climbed +36.5% to rank 3 and Blue Haze Infused Pre-Roll 7-Pack (3.5g) rose +27.3% to rank 4, pointing to a pivot from large-format Flower toward concentrates and infused pre-rolls. With two infused pre-rolls in the top ten and four top-10 slots captured by Concentrates, September 2026 mix points to a higher-THC, value-per-dose proposition over bulk Flower, implying Hudson Cannabis is leaning into potency-led formats and away from ounce-driven volume.
Top Selling Cannabis Brands






Data for this report comes from real-time sales reporting by participating cannabis retailers via their point-of-sale systems, which are linked up with Headset’s business intelligence software. Headset’s data is very reliable, as it comes digitally direct from our partner retailers. However, the potential does exist for misreporting in the instance of duplicates, incorrectly classified products, inaccurate entry of products into point-of-sale systems, or even simple human error at the point of purchase. Thus, there is a slight margin of error to consider. Brands listed on this page are ranked in the top twenty within the market and product category by total retail sales volume.

