.svg)

Aug-2026
Sales
Trend
6-Month
Product Count
SKUs
Avg Price
YoY Sales Change
YoY Price Change


Market Insights Snapshot
In August 2026, ALLDAY. split its sales almost evenly between Pre-Roll at 51.21% share and Flower at 48.79% share, but the month-over-month momentum was uneven: Pre-Roll grew 50.62% MoM while Flower rose 38.36% MoM. Despite Pre-Roll carrying the largest share at 51.21%, the category’s average price sat at $20.16 versus $46.43 for Flower, indicating unit mix rather than pricing drove the 50.62% MoM lift. With Pre-Roll ranked 49th in New Jersey and Flower close behind in share, the dual-category surge suggests ALLDAY. is tilting toward volume gains in Pre-Roll while maintaining a nearly parity contribution from higher-priced Flower, implying the brand is prioritizing basket entry via Pre-Roll while using Flower to support revenue per transaction.
The simultaneous 50.62% MoM increase in Pre-Roll and 38.36% MoM rise in Flower, paired with a narrow 2.42-point share gap, indicates a barbell positioning: accessible Pre-Rolls to accumulate units and premium-priced Flower to sustain average order value. With Pre-Roll sitting at rank 49 in New Jersey while commanding 51.21% of brand mix, August 2026 performance implies that market share growth will likely rely on converting Pre-Roll volume into rank improvement while preventing cannibalization of the 48.79% Flower base; the pattern points to leveraging price elasticity in Pre-Roll alongside selective SKU depth in Flower to stabilize margins as unit counts scale.
Competitive Landscape
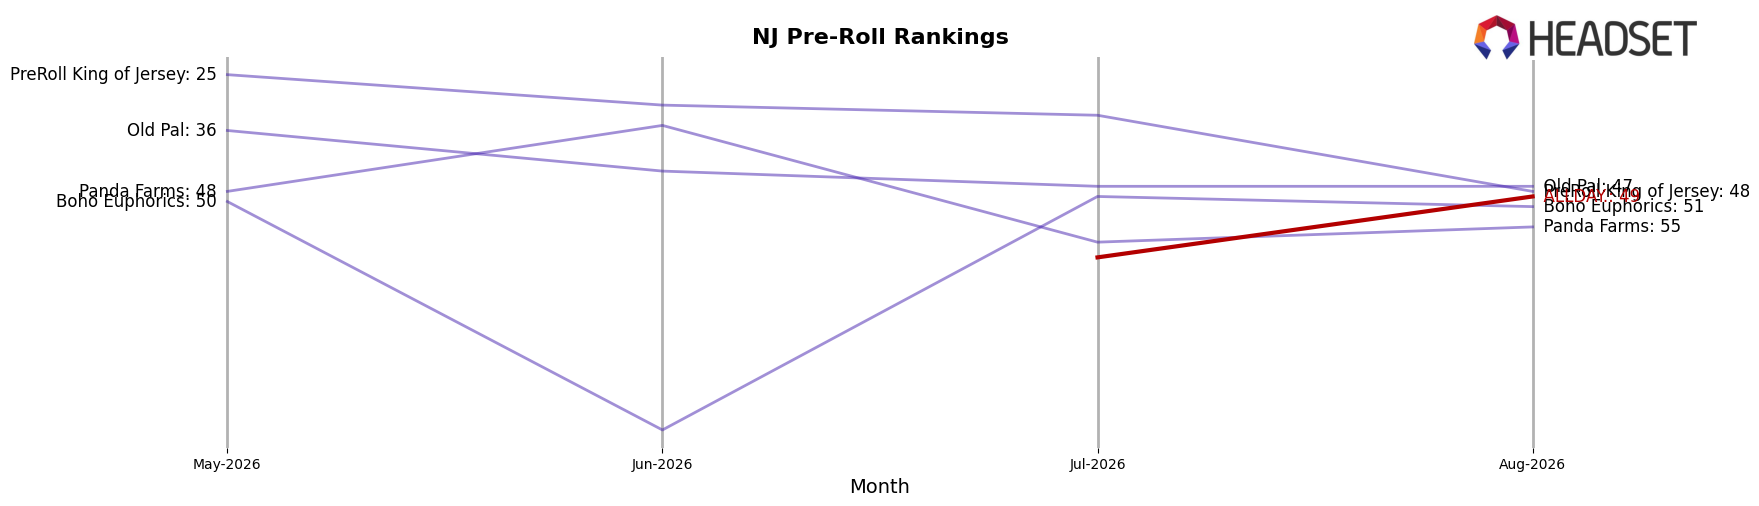
ALLDAY. sits at rank 49 in New Jersey Pre-Roll in August 2026, with no reported year-over-year rank change and a peak rank matching 49 in August 2026; this places the brand far from the category lead where RYTHM is ranked 1 after a year-over-year climb of 3 spots and sales up 29.7%, while Ozone reached rank 2 with a 7-spot YoY rise and 76.1% sales growth, and Dogwalkers holds rank 3 after an 8-spot gain with 6.9% sales growth; conversely, Lowell Herb Co / Lowell Smokes fell 2 ranks to 5 with a 55.4% sales decline, indicating that while upward mobility is possible within the top tier, ALLDAY.’s flat trajectory at 49 implies limited share penetration without a catalyst to move from peak-at-entry positioning into the mid-tier ranks.
Notable Products
Limesicle (3.5g) posted the largest month-over-month surge at +242.7% and climbed to rank 3, while Orange Cannoli Pre-Roll 2-Pack (1g) fell -53.2% to rank 6, indicating a sharp reallocation toward Flower over smaller Pre-Roll formats. Total Eclipse Pre-Roll 2-Pack (1g) also jumped +173.6% to rank 5 as Orange Cannoli Pre-Roll 5-Pack (2.5g) slipped -14.6% to rank 4, and five of the top ten are Pre-Roll SKUs, signaling format breadth even as demand concentrates in a few winners. With Limesicle Pre-Roll 5-Pack (2.5g) at rank 1 and Limesicle (7g) at rank 8 alongside $23,536 in Limesicle (3.5g) sales, Limesicle-branded SKUs anchor both Flower and Pre-Roll positions across ranks 1, 3, and 8. The pattern implies ALLDAY. is tilting assortments toward Limesicle-led anchor SKUs and selective two-pack Pre-Roll bets, consolidating share in fewer, faster-moving items.
Top Selling Cannabis Brands






Data for this report comes from real-time sales reporting by participating cannabis retailers via their point-of-sale systems, which are linked up with Headset’s business intelligence software. Headset’s data is very reliable, as it comes digitally direct from our partner retailers. However, the potential does exist for misreporting in the instance of duplicates, incorrectly classified products, inaccurate entry of products into point-of-sale systems, or even simple human error at the point of purchase. Thus, there is a slight margin of error to consider. Brands listed on this page are ranked in the top twenty within the market and product category by total retail sales volume.

