Jun-2026
Sales
Trend
6-Month
Product Count
SKUs
Avg Price
YoY Sales Change
YoY Price Change
Market Insights Snapshot
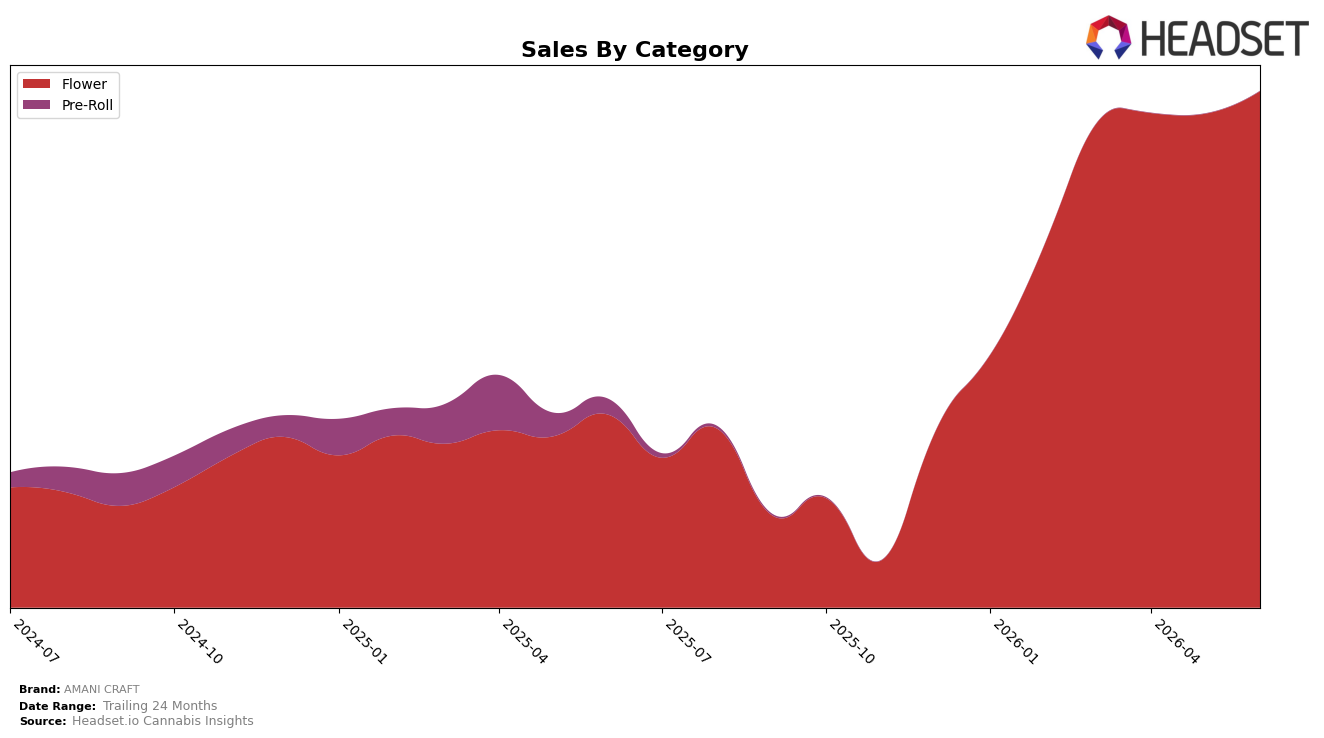
In June 2026, AMANI CRAFT’s mix was concentrated entirely in Flower at 100.0% share, with category sales up 168.03% year over year and 4.59% month over month, while the overall brand grew 148.04% YoY and lifted average price by 44.45%. Within the British Columbia Flower context, the brand sat at rank 10, and the month-over-month uptick of 4.59% alongside a rank position of 10 signals momentum concentrated in a single category rather than diversified lift; the pattern implies that June 2026 performance is being carried by deepening Flower penetration rather than portfolio breadth.
The combination of a 100.0% Flower mix and a 44.45% YoY rise in average price at an absolute price point of $45.43, alongside a 4.59% MoM sales gain and rank 10 in British Columbia Flower, implies positioning toward premiumized Flower where price elasticity has not capped volume. With brand-level YoY growth at 148.04% trailing Flower’s 168.03% YoY, the category is pacing ahead of the brand baseline, suggesting AMANI CRAFT’s near-term opportunity is to defend and climb from rank 10 by leaning into high-price Flower segments while testing adjacent categories only if they can match the 4.59% MoM velocity without diluting the premium signal.
Competitive Landscape
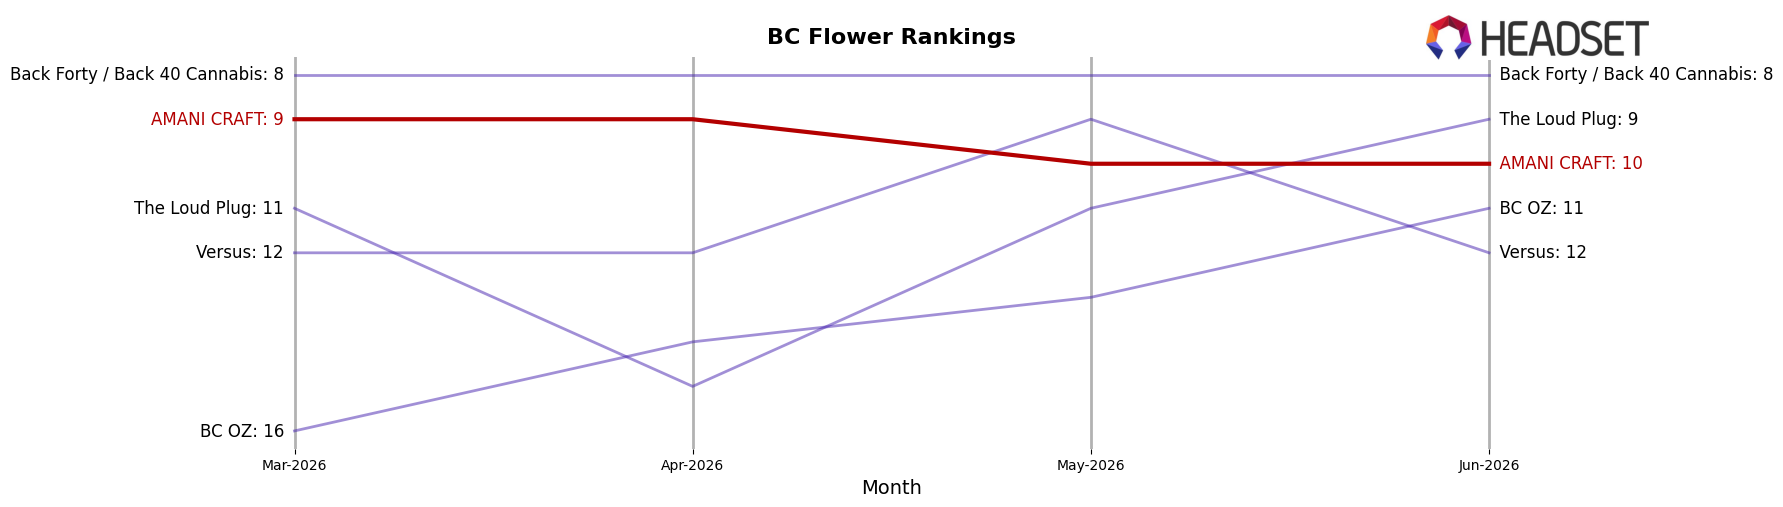
AMANI CRAFT is ranked #10 in BC Flower in June 2026, a 17-place climb from #27 year over year, while slipping 1 spot from its three-month position of #9 and matching its April 2026 peak rank of #9; in contrast, Good Supply sits at #1 after rising from #6 year over year and Spinach advanced to #3 from #8 as its annual sales grew 84.9%, indicating that AMANI CRAFT’s upward rank mobility is real but lags the pace of top movers and therefore implies a stabilization phase rather than a breakout.
Notable Products
Turbulence (7g) posted the standout move in June 2026 with an 86.6% month-over-month surge to the #2 rank, while Gastro Pop Smalls (3.5g) rose 32.3% to hold #1. At the same time, Turbulence (14g) collapsed by -97.2% at #10 and Gastro Pop (7g) fell -87.1% at #8, indicating extreme volatility at mid-to-large sizes. The concentration remains heavy in Flower, with all ten top SKUs in the category and multiple Gastro Pop formats spanning #1, #3, #5, #6, and #8 alongside several Turbulence variants, pointing to a format-driven mix where 7g and smalls are gaining while 14g and 7g standards bifurcate.
Av Gas Smalls (3.5g) jumped 165.8% to #9 even off a small base of $1.0K, contrasting with Turbulence Smalls (3.5g) down -25.0% at #4 and Turbulence (3.5g) down -23.7% at #7. Gastro Pop (14g) inched up 9.2% at #3 while Gastro Pop (28g) added 11.0% at #6, versus Gastro Pop (3.5g) down -35.1% at #5. The pattern implies AMANI CRAFT is consolidating share around upsized and smalls formats tied to a few strain families, pruning underperforming 14g and 7g variants while leaning into the SKUs with clearer velocity.
Top Selling Cannabis Brands
Data for this report comes from real-time sales reporting by participating cannabis retailers via their point-of-sale systems, which are linked up with Headset’s business intelligence software. Headset’s data is very reliable, as it comes digitally direct from our partner retailers. However, the potential does exist for misreporting in the instance of duplicates, incorrectly classified products, inaccurate entry of products into point-of-sale systems, or even simple human error at the point of purchase. Thus, there is a slight margin of error to consider. Brands listed on this page are ranked in the top twenty within the market and product category by total retail sales volume.

