Jun-2026
Sales
Trend
6-Month
Product Count
SKUs
Avg Price
YoY Sales Change
YoY Price Change
Market Insights Snapshot
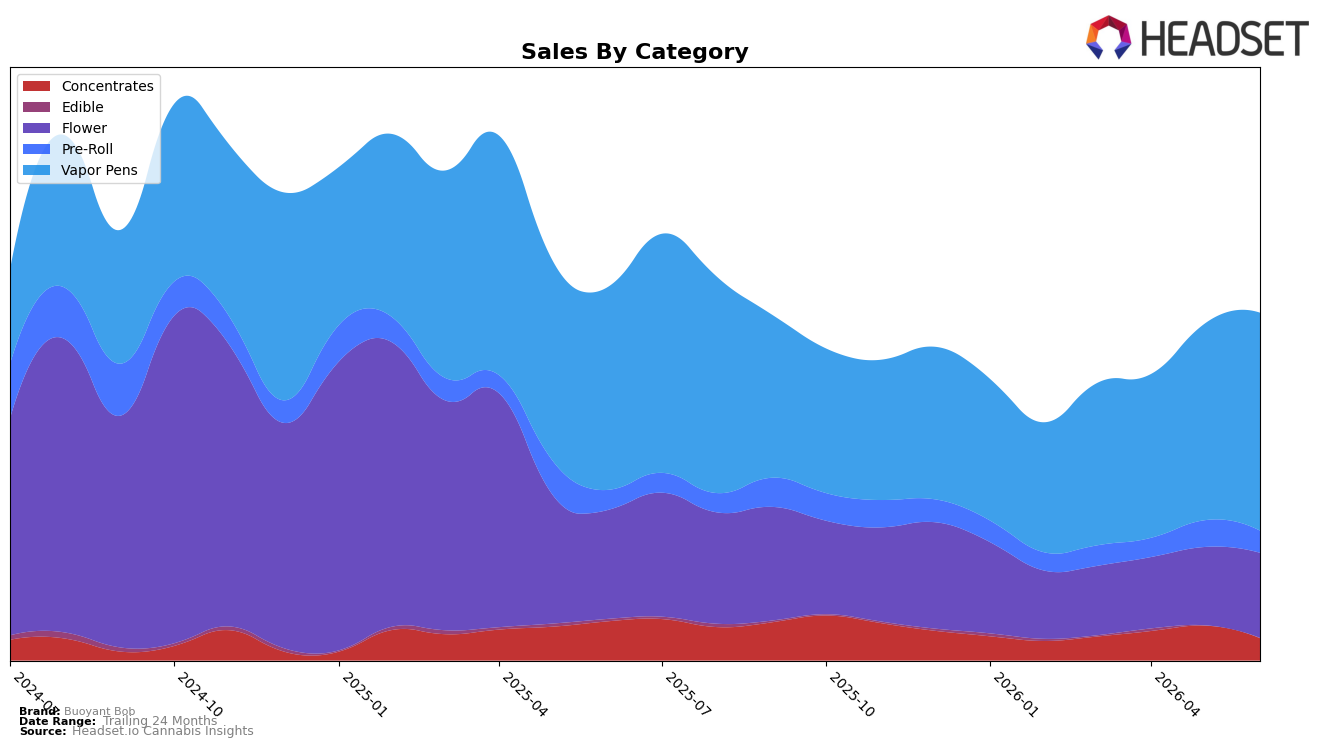
In June 2026, Buoyant Bob leaned harder into Vapor Pens at 61.68% share with year-over-year growth of 7.25% and month-over-month growth of 10.81%, while Flower held 24.35% share but fell year-over-year by 21.60% despite an 8.49% month-over-month lift; combined, these shifts helped offset a -6.79% brand sales year-over-year decline and a -4.19% average price change. Meanwhile, Concentrates dropped year-over-year by 41.34% and month-over-month by 34.33% to 6.75% share, and Pre-Roll mixed a 9.93% year-over-year gain with a -16.22% month-over-month dip at 6.68% share, implying the brand is concentrating demand in higher-velocity pen SKUs as seasonal volatility drains smaller formats.
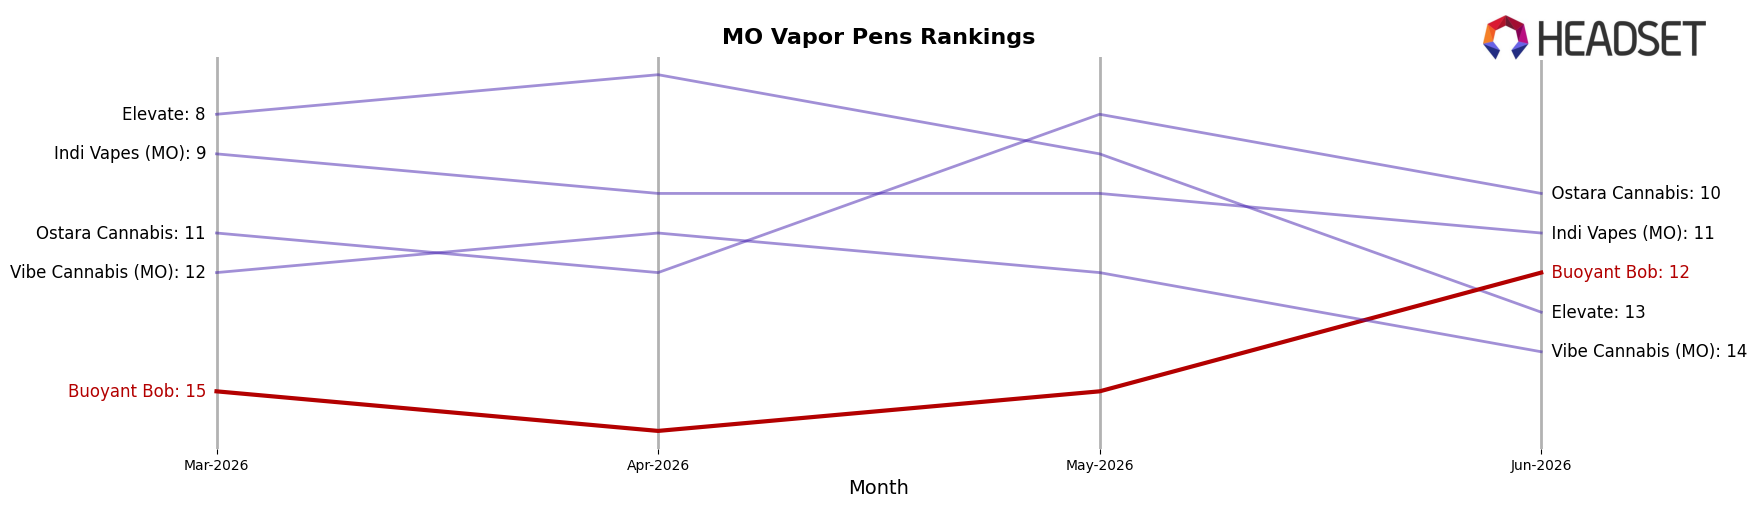
That category mix positions Buoyant Bob to compete on Vapor Pens where its June 2026 rank is 12 in Missouri, but the -21.60% year-over-year decline in Flower alongside a -41.34% drop in Concentrates raises reliance risk if pen momentum slows; the simultaneous 10.81% month-over-month pen growth and -16.22% month-over-month Pre-Roll pullback suggest promo or assortment tactics are tilting share rather than expanding the total base. With average price down 4.19% year-over-year and Concentrates shrinking 34.33% month-over-month, the pattern implies a deliberate tilt toward accessible Vapor Pen price points to defend rank 12 while ceding depth in high-variability extract segments.
Competitive Landscape
Buoyant Bob sits at rank #12 in MO Vapor Pens for June 2026, unchanged year over year at #12 while improving 3 positions from #15 three months ago; this follows a decline from a peak of #7 in April 2025, indicating a 5-rank slide from that high-water mark. In contrast, Good Day Farm climbed from #10 to #2 year over year with a 78.8% sales increase, and Galactic moved from #5 to #3 alongside a 51.7% sales gain, while category leader Illicit / Illicit Gardens held #1 year over year with 27.6% sales growth; relative to these moves, Buoyant Bob’s flat YoY rank at #12 paired with a recent 3-position quarter-over-quarter lift implies stabilization at the lower edge of the top tier rather than a return to its April 2025 peak trajectory.
Notable Products
Hard Lemonade Distillate Cartridge (1g) posted the largest movement with a +54.0% month-over-month surge to rank 1, while Mai Tai Distillate Cartridge (1g) fell -41.8% to rank 9. Strawberry Daiquiri Distillate Cartridge (1g) rose +31.0% to rank 2 and Blue Dream Distillate Cartridge (1g) climbed +35.3% to rank 3, and eight of the top ten are Vapor Pens. This tilt toward fruit-forward Vapor Pens at ranks 1–3, alongside a -7.5% slide for Kayak Crush Distillate Cartridge (1g) at rank 10, implies the mix is consolidating around a few high-velocity flavors rather than broad-based growth. The pattern points to a strategy where June 2026 allocation favors leading Vapor Pen SKUs with outsized momentum, even as laggards signal selective pruning.
Top Selling Cannabis Brands
Data for this report comes from real-time sales reporting by participating cannabis retailers via their point-of-sale systems, which are linked up with Headset’s business intelligence software. Headset’s data is very reliable, as it comes digitally direct from our partner retailers. However, the potential does exist for misreporting in the instance of duplicates, incorrectly classified products, inaccurate entry of products into point-of-sale systems, or even simple human error at the point of purchase. Thus, there is a slight margin of error to consider. Brands listed on this page are ranked in the top twenty within the market and product category by total retail sales volume.

