.svg)

Aug-2026
Sales
Trend
6-Month
Product Count
SKUs
Avg Price
YoY Sales Change
YoY Price Change


Where to Buy
Bakked is stocked at 91 licensed dispensaries across Mississippi, Colorado, and West Virginia, 72 of them in Mississippi, with the deepest coverage in Jackson, Hattiesburg, Pearl, Tupelo, and Gulfport. Search by ZIP code or city below to find the closest one, or filter by product type if you are after a specific format.
Market Insights Snapshot
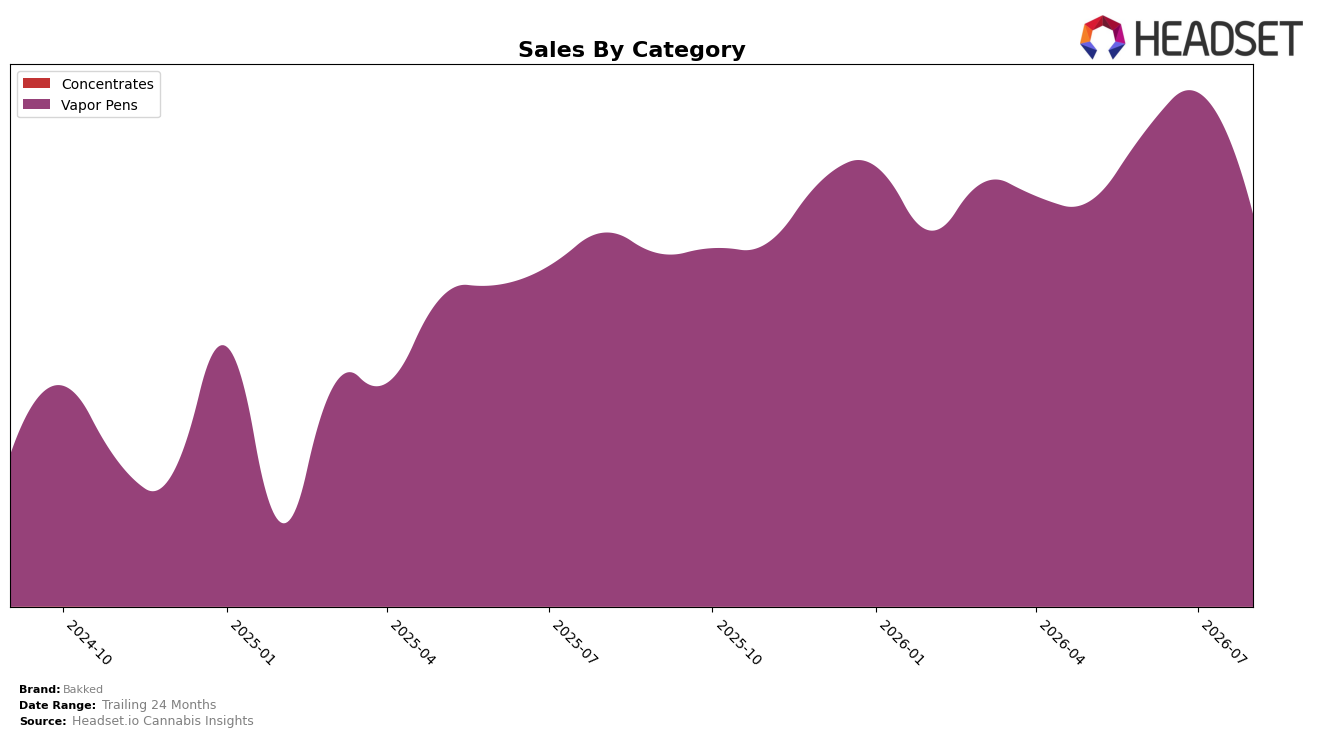
In August 2026, Bakked’s category mix was fully concentrated in Vapor Pens at 100.0% share, with category sales up 4.97% year over year but down 23.66% month over month, and average price down 2.25% YoY. The brand held rank 29 in Vapor Pens in Colorado, a position that, paired with a 23.66% MoM decline amid a 4.97% YoY lift, implies stability in annual demand but exposure to intra-quarter volatility that can pressure weekly sell-through.
The mix concentration at 100.0% Vapor Pens combined with a 2.25% YoY price decrease and a 23.66% MoM sales contraction suggests Bakked is trading lower prices to sustain annual volume while sacrificing near-term revenue velocity. Holding rank 29 in Vapor Pens in Colorado alongside a 4.97% YoY increase indicates mid-pack positioning where incremental share gains will likely depend on mitigating month-to-month swings and monetizing the August 2026 price architecture rather than expanding into adjacent categories.
Competitive Landscape
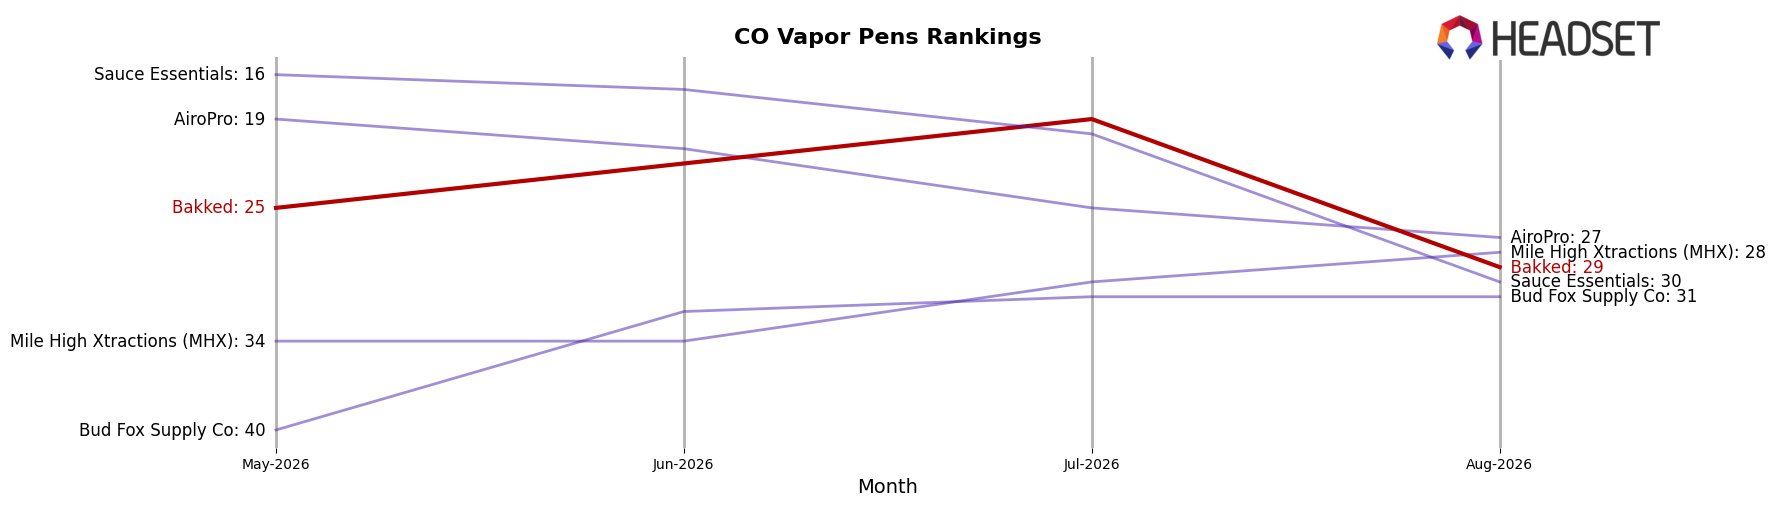
Bakked sits at rank 29 in Colorado Vapor Pens in August 2026, unchanged year over year at 29 but down 4 positions from May 2026’s rank 25, after peaking at rank 19 in July 2026; this contrasts with Spherex holding rank 1 year over year and in August 2026 while growing sales by 9.49%, and Batch Extracts moving from rank 4 to rank 2 alongside a 72.29% sales increase. Meanwhile, Jetty Extracts climbed from rank 6 to rank 4 with 56.65% YoY sales growth, and Green Dot Labs advanced from rank 8 to rank 5 with 58.31% YoY growth, indicating that Bakked’s flat YoY rank at 29 and recent slide from rank 25 to 29 imply share is being ceded to faster-rising rivals and that maintaining the July 2026 peak rank 19 level will require outpacing double-digit competitor growth rates.
Notable Products
Lemon Cherry Gelato Distillate Cartridge (1g) posted the steepest decline in August 2026 at -60.5% MoM while falling to rank 9, and Maui Wowie Distillate Cartridge (1g) also contracted -53.1% MoM at rank 7, indicating a sharp reset among formerly higher-velocity SKUs. In contrast, Son of a Peach Distillate Cartridge (1g) grew 14.6% MoM to hold rank 1 and Blueberry Muffin Distillate Cartridge (1g) rose 18.7% MoM at rank 8, suggesting selective flavor stickiness against broader pullbacks. With all top-10 items in Vapor Pens and four ranks between 4 and 6 sliding between -20.0% and -34.9%, the portfolio is concentrated and exposed to volatility; the mix implies Bakked is prioritizing breadth within one format while needing fresher launches or pricing levers to stabilize mid-tier flavors.
Top Selling Cannabis Brands






Data for this report comes from real-time sales reporting by participating cannabis retailers via their point-of-sale systems, which are linked up with Headset’s business intelligence software. Headset’s data is very reliable, as it comes digitally direct from our partner retailers. However, the potential does exist for misreporting in the instance of duplicates, incorrectly classified products, inaccurate entry of products into point-of-sale systems, or even simple human error at the point of purchase. Thus, there is a slight margin of error to consider. Brands listed on this page are ranked in the top twenty within the market and product category by total retail sales volume.

