Jun-2026
Sales
Trend
6-Month
Product Count
SKUs
Avg Price
YoY Sales Change
YoY Price Change
Market Insights Snapshot
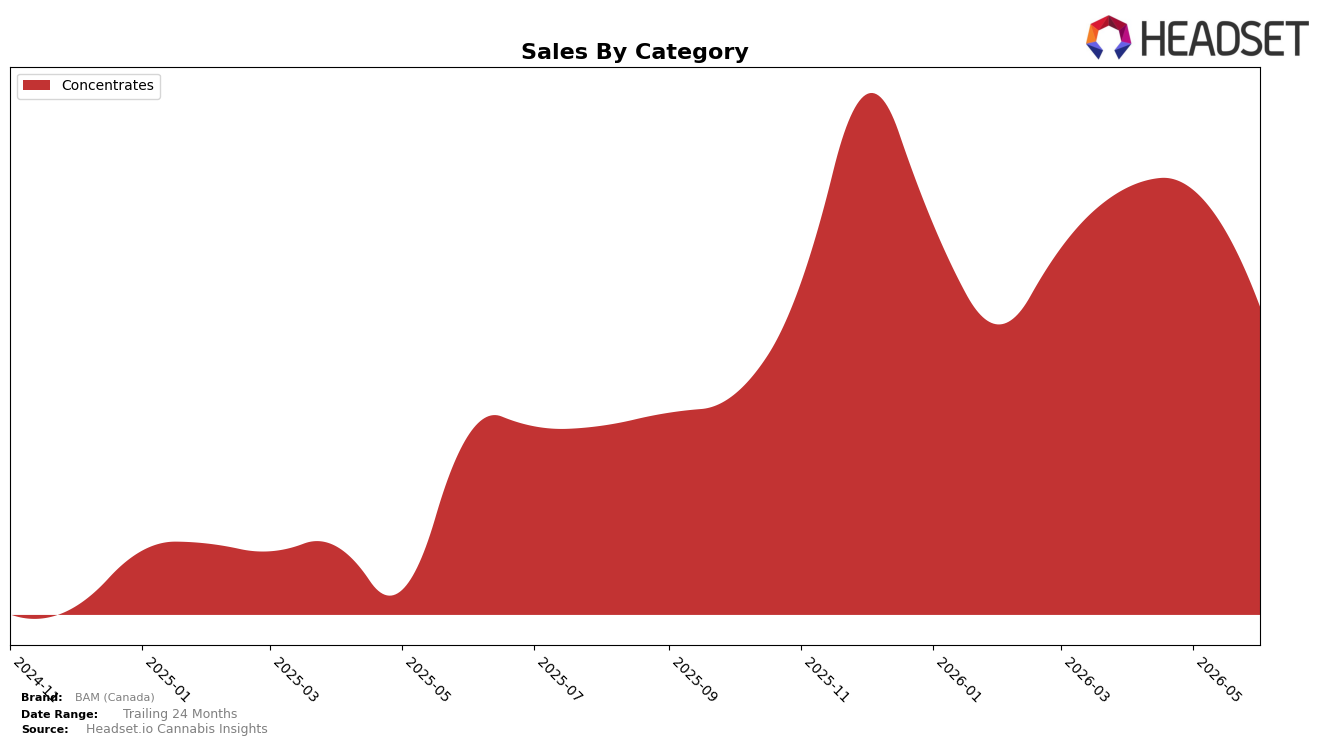
In June 2026, BAM (Canada) operated as a single-category brand with Concentrates accounting for 100.0% of sales, pairing a 61.9% year-over-year increase with a -26.0% month-over-month decline. Average price rose 6.6% YoY to $29.73 while category share remained concentrated at 100.0%, indicating no portfolio diversification alongside a sharp monthly pullback. The pattern implies a surge in annual demand offset by short-term volatility, suggesting seasonality or promotional timing is driving swings rather than cross-category ballast.
Positionally, the brand’s narrow focus leaves limited insulation against monthly shocks, as evidenced by a -26.0% MoM drop coexisting with a 61.9% YoY rise, while a $29.73 average price alongside a 6.6% YoY price increase indicates pricing power concentrated within a single format. Holding rank 9 in Concentrates in Saskatchewan reinforces mid-pack visibility without breadth, implying that sustaining growth will depend on deepening penetration within Concentrates rather than relying on category mix to smooth volatility.
Competitive Landscape
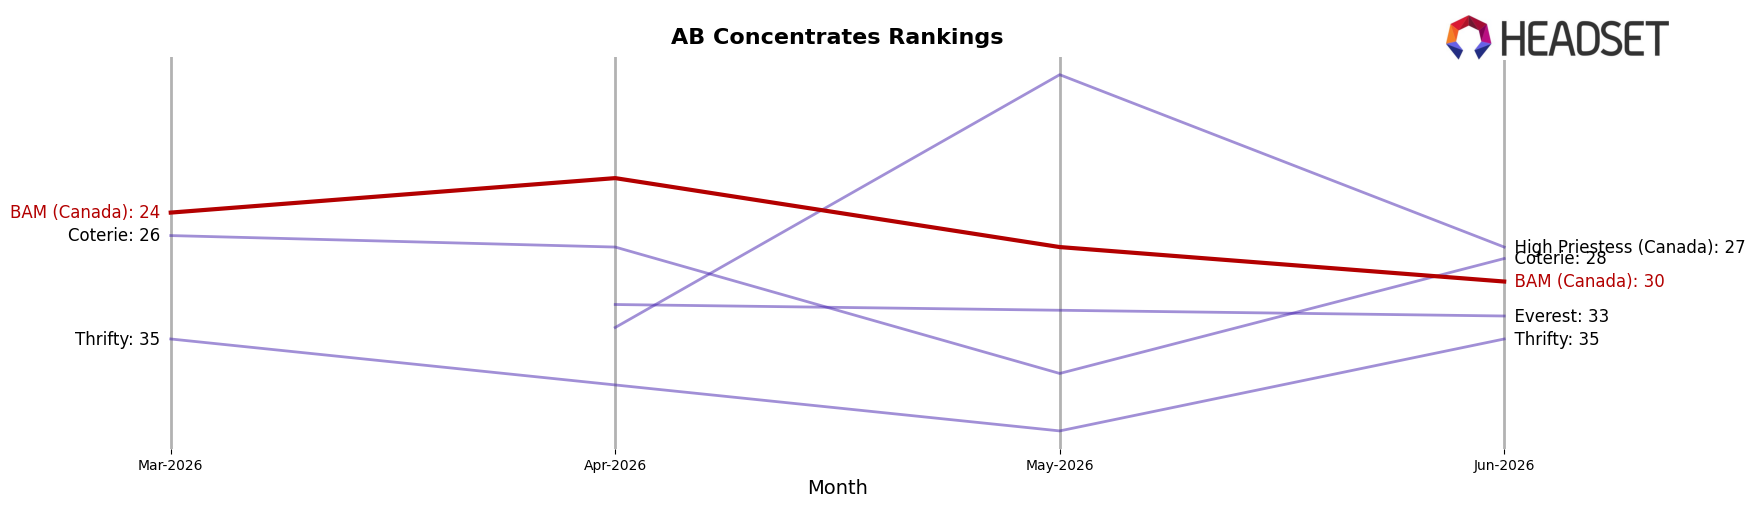
BAM (Canada) sits at rank #30 in AB Concentrates in June 2026, a drop of 5 positions from #25 year over year, and down 6 spots from its March 2026 level of #24; compared with its peak of #15 in December 2025, the current position is 15 ranks lower, indicating a sustained slide while category leaders reshuffle. Competitively, BoxHot climbed from #2 to #1 with a 37.9% year-over-year sales increase, while Endgame fell from #1 to #2 alongside a 23.4% decline, and Dab Bods held #3 with 59.0% growth, suggesting the top tier is consolidating share as mid-pack brands lose rank. The pattern implies BAM (Canada)’s downward rank trajectory amid leaders gaining or defending positions points to share leakage that will likely persist without a deliberate move into faster-growing subsegments.
Notable Products
Bazooka Berry Diamonds and Sauce (1.2g) led the month’s movement with a -64.8% month-over-month drop while sliding to rank 4, implying demand concentration is shifting away from this SKU toward higher-ranked alternatives. In contrast, Sour Cherry Smith Diamonds and Sauce (1.2g) climbed 25.2% MoM to rank 3 as Pineapple Glimmer Whipped Diamonds (1.2g) fell -17.8% at rank 1, suggesting share is rotating within the lineup rather than expanding the category footprint. With four of the top five in June 2026 belonging to Concentrates and the 1g Sour Cherry variant dipping -6.8% at rank 5, the split performance across sizes indicates buyers are gravitating to premium 1.2g formats over smaller packs, pointing BAM (Canada) toward prioritizing depth in leading 1.2g SKUs and pruning underperforming flavors.
Top Selling Cannabis Brands
Data for this report comes from real-time sales reporting by participating cannabis retailers via their point-of-sale systems, which are linked up with Headset’s business intelligence software. Headset’s data is very reliable, as it comes digitally direct from our partner retailers. However, the potential does exist for misreporting in the instance of duplicates, incorrectly classified products, inaccurate entry of products into point-of-sale systems, or even simple human error at the point of purchase. Thus, there is a slight margin of error to consider. Brands listed on this page are ranked in the top twenty within the market and product category by total retail sales volume.

