.svg)

Sep-2026
Sales
Trend
6-Month
Product Count
SKUs
Avg Price
YoY Sales Change
YoY Price Change


Market Insights Snapshot
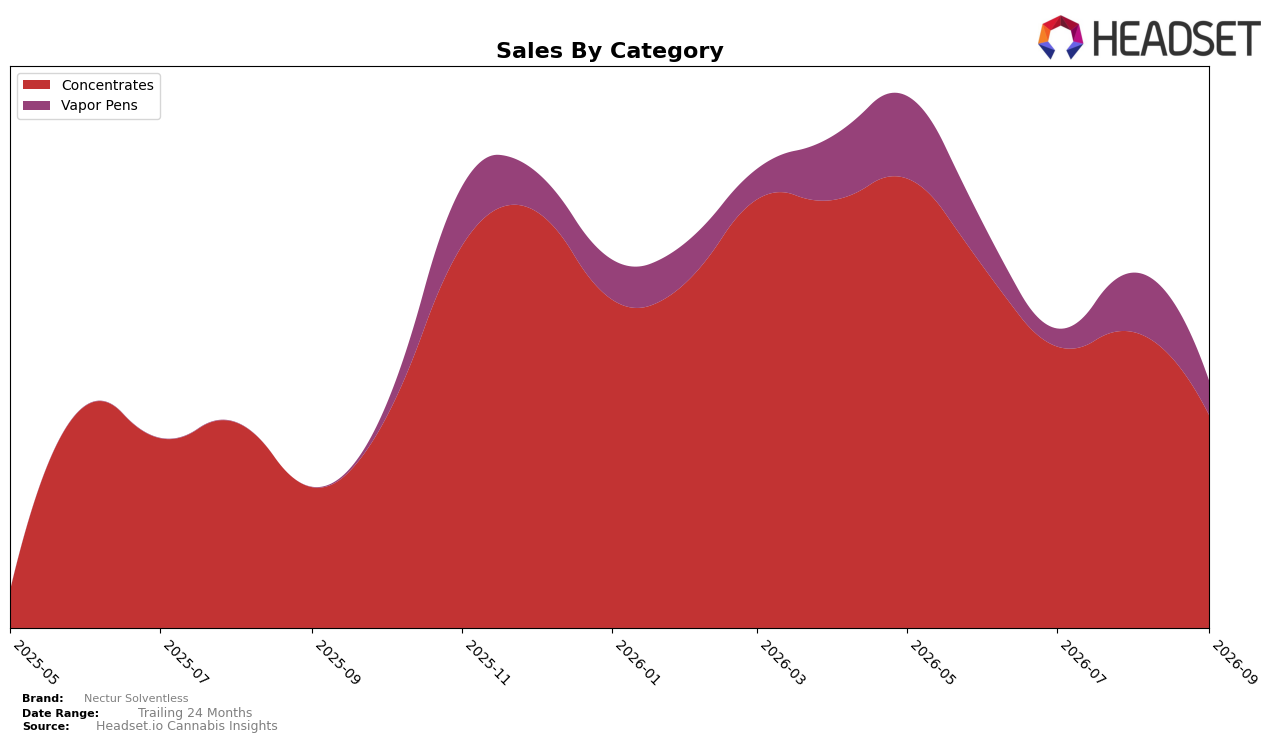
In September 2026, Nectur Solventless concentrated 86.25% of sales in Concentrates with a 51.11% year-over-year increase, while Vapor Pens held 13.75% share with no year-over-year baseline and a 42.67% month-over-month drop; Concentrates also fell 28.27% month over month, pulling total mix toward the legacy core even as overall brand sales rose 75.21% year over year. Within Concentrates, the average price at $64.91 sat above the brand’s blended $60.22 as average price declined 7.21% year over year, indicating volume-led gains despite a simultaneous month-over-month contraction across both categories; this pattern implies price elasticity and promotional depth are concentrating volume in the core segment rather than expanding the portfolio breadth in September 2026.
Given a 22 rank in Concentrates in Alberta alongside an 86.25% category share and a 28.27% month-over-month dip, Nectur Solventless is positioned as a mid-pack specialist whose momentum depends on sustaining core penetration rather than diversifying into Vapor Pens. The 13.75% share in Vapor Pens with a 42.67% month-over-month decline, paired with a 51.11% year-over-year rise in Concentrates and a 7.21% brand-level average price reduction, implies that near-term gains will come from reinforcing the flagship Concentrates value proposition and selectively stabilizing price rather than allocating incremental resources to Vapor Pens in September 2026.
Competitive Landscape
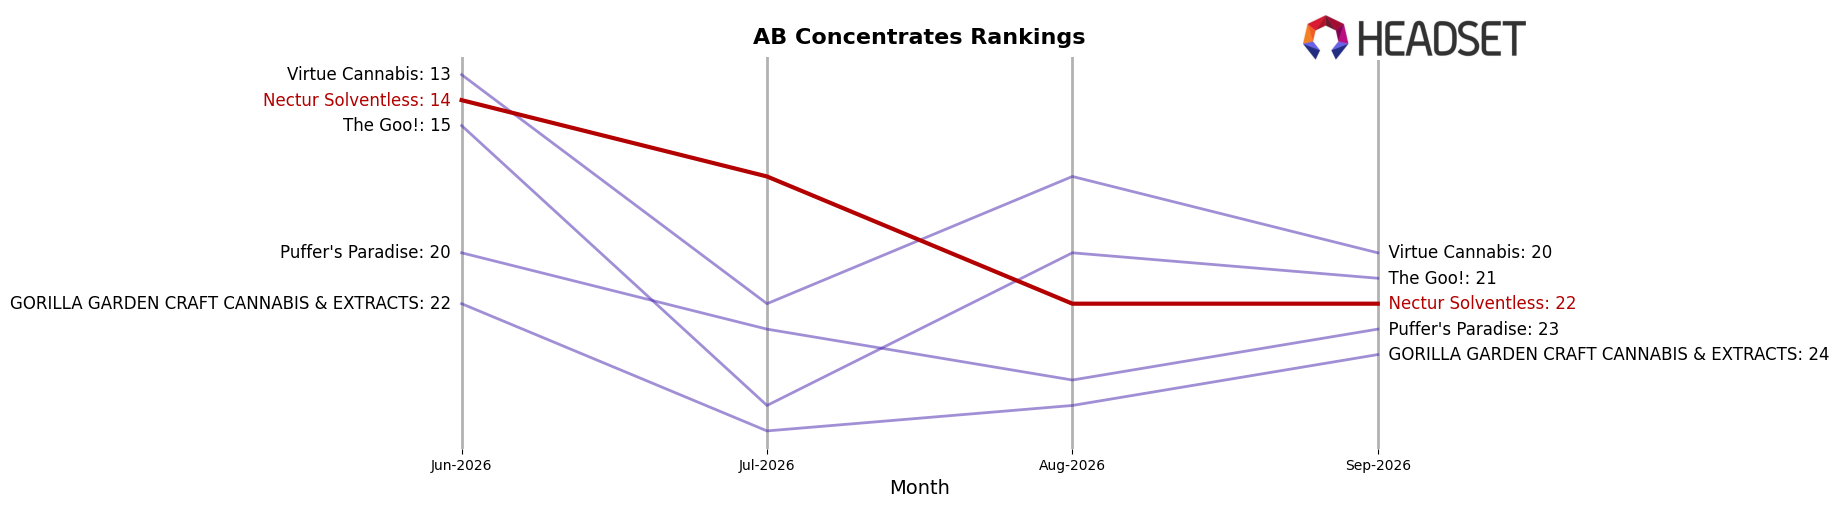
Nectur Solventless sits at rank #22 in September 2026 in AB Concentrates, improving 7 positions year over year from #29 and falling 8 spots since June 2026 when it was #14; the swing from a peak of #9 in May 2026 to #22 by September 2026 signals mid-year momentum that faded. Against competitors, BoxHot held #1 with a 5.8% YoY sales increase while Nectur slid 8 ranks from its May 2026 peak, and Sticky Greens surged to #5 from #61 YoY with a 2,757.0% sales lift, indicating share consolidation at the top as Nectur’s 3-month rank drop of 8 contrasts with rivals’ upward trajectories. The pattern implies Nectur’s YoY rank gain of 7 is being eclipsed by sharper competitor ascents, so without a reversal of the May-to-September rank decline of 13 places, the brand risks continued erosion of relative position.
Notable Products
Slurricane Cold Cured Live Hash Rosin (1g) posted the steepest decline at -77.9% MoM while falling to rank 5, whereas Rainbow Guava Cold Cured Live Hash Rosin (1g) surged +115.9% MoM to a clustered rank position at 4 alongside two other Concentrates. Glitter Bomb Cold Cured Live Hash Rosin (1g) held rank 1 with a +4.2% MoM uptick, and the brand’s Vapor Pens slumped with Rotating Solventless Cold Cured Live Hash Rosin Disposable (0.5g) down -41.3% at rank 2 versus Glitter Bomb Live Hash Rosin Disposable (0.5g) at rank 6 and -45.2% MoM. With six of the top ten coming from Concentrates and three titles sharing rank 4, the mix points to a pivot toward solventless Concentrates where volatility is yielding rapid share rotation at mid-table ranks, implying resource allocation should favor expanding high-velocity SKUs over stabilizing underperforming pens.
Top Selling Cannabis Brands






Data for this report comes from real-time sales reporting by participating cannabis retailers via their point-of-sale systems, which are linked up with Headset’s business intelligence software. Headset’s data is very reliable, as it comes digitally direct from our partner retailers. However, the potential does exist for misreporting in the instance of duplicates, incorrectly classified products, inaccurate entry of products into point-of-sale systems, or even simple human error at the point of purchase. Thus, there is a slight margin of error to consider. Brands listed on this page are ranked in the top twenty within the market and product category by total retail sales volume.

