.svg)

Sep-2026
Sales
Trend
6-Month
Product Count
SKUs
Avg Price
YoY Sales Change
YoY Price Change


Market Insights Snapshot
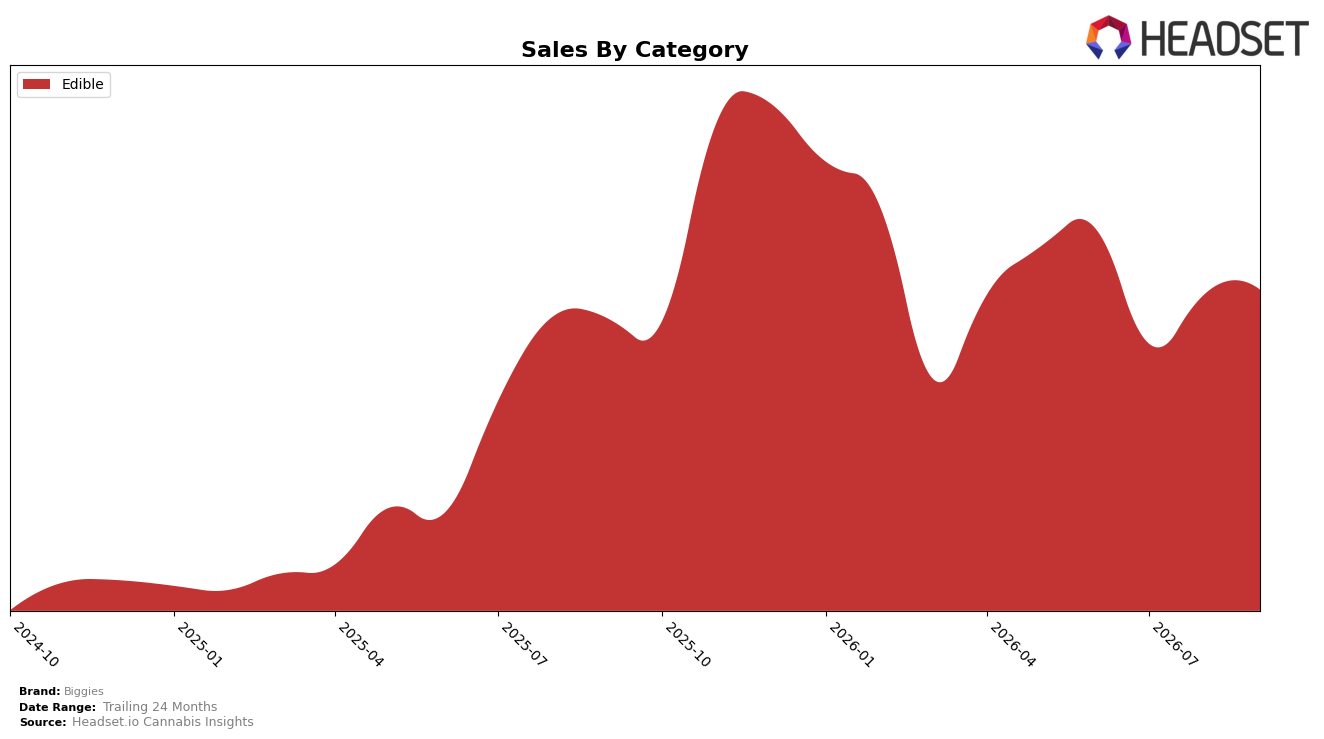
In September 2026, Biggies concentrated entirely in Edible, with category share at 100.0% and rank 9 in British Columbia’s Edible segment. Within this single-category focus, sales grew 9.0% year over year while month over month rose 1.3%, alongside a 92.6% YoY increase in average price to $21.10. The combination of a 100.0% category allocation and rank 9 implies Biggies is trading depth for focus; the 9.0% YoY sales gain paired with only 1.3% MoM suggests momentum is steady but reliant on price mix rather than volume diversification.
The widening price delta (92.6% YoY) versus more modest sales growth of 9.0% YoY and 1.3% MoM, within a 100.0% Edible mix, points to up-tiering rather than portfolio breadth, which at rank 9 caps upside unless the price premium converts to higher unit velocity. With Biggies anchored in British Columbia at rank 9 and no cross-category spillover, the pattern implies the brand’s positioning leans into premiumization in Edible; to climb from rank 9, the observed 1.3% MoM lift would need either faster repeat at current price points or selective category expansion to mitigate single-category exposure.
Competitive Landscape
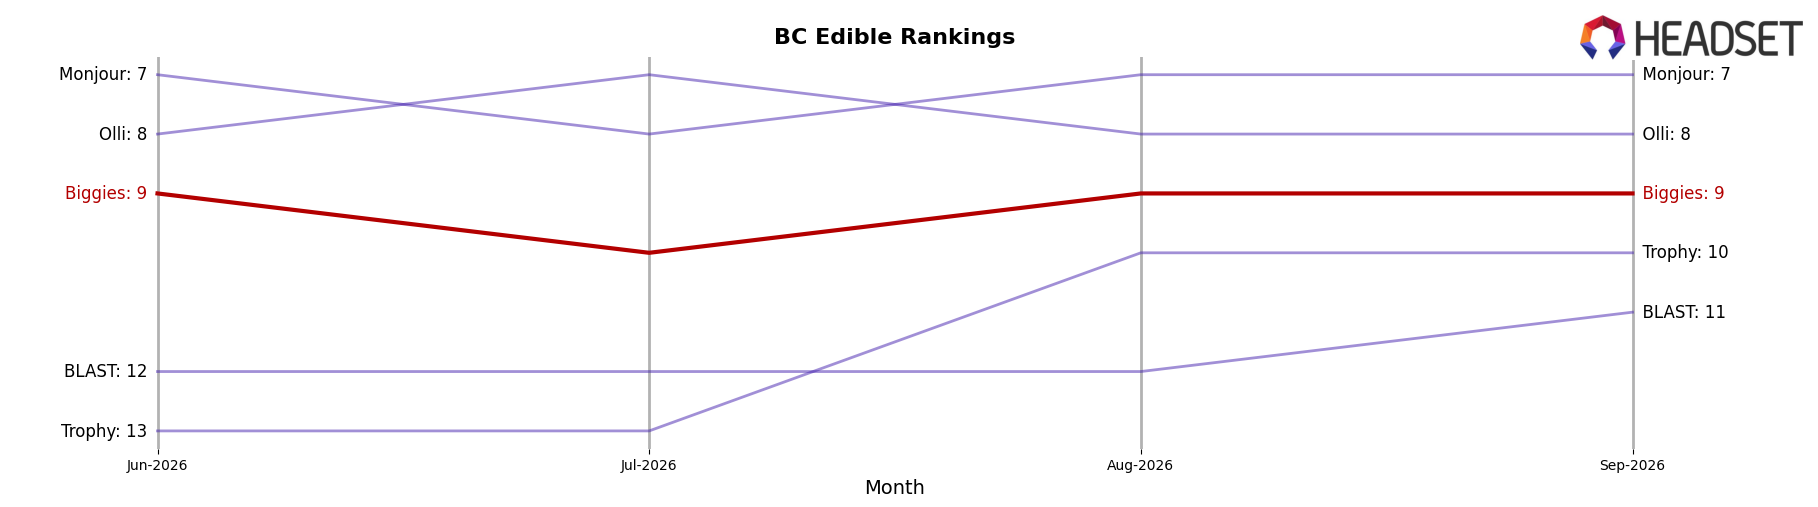
Biggies sits at rank #9 in BC Edible for September 2026, improving 1 position from #10 year over year, while holding flat versus June 2026 at #9; that stability contrasts with Spinach advancing from #2 to #1 with a 31.6% YoY sales increase and Gron / Grön sliding from #1 to #2 amid a 2.3% YoY decline. The category’s middle tier is becoming more compressed as Wyld climbed from #5 to #4 on 120.3% YoY growth and 1964 Supply Co rose from #6 to #5 with 89.6% YoY growth, while Biggies’ peak of #8 in December 2025 and current #9 suggest a narrow band of movement rather than breakout momentum, implying the brand is defending share but not yet converting into the faster-rising cohort.
Notable Products
XXL - CBG/CBD/THC 4:4:1 Orange Creamsicle Gummies 4-Pack (40mg CBG, 40mg CBD, 10mg THC) posted the standout move in September 2026 with +105% month over month while climbing into rank 6, contrasting with XXL -CBG/CBD/THC 3:3:1 Raspberry Ginger Ale Gummies 6-Pack (60mg THC, 180mg CBG, 180mg CBD) falling -21% at rank 2. Sour Cherry Bombs Gummies 30-Pack (300mg) advanced +50% to hold rank 1 with approximately $66,681 in sales, while Sour Green Apple Live Resin Chew 30-Pack (300mg) slid -37% at rank 3. With all top-10 items in Edible and multiple XXL and Sour family SKUs clustered in the top five, the mix points to Biggies leaning into flavor-led variety packs where higher-potency or functional ratios can swing share quickly.
Top Selling Cannabis Brands






Data for this report comes from real-time sales reporting by participating cannabis retailers via their point-of-sale systems, which are linked up with Headset’s business intelligence software. Headset’s data is very reliable, as it comes digitally direct from our partner retailers. However, the potential does exist for misreporting in the instance of duplicates, incorrectly classified products, inaccurate entry of products into point-of-sale systems, or even simple human error at the point of purchase. Thus, there is a slight margin of error to consider. Brands listed on this page are ranked in the top twenty within the market and product category by total retail sales volume.

