.svg)

Sep-2026
Sales
Trend
6-Month
Product Count
SKUs
Avg Price
YoY Sales Change
YoY Price Change


Where to Buy
BLAST is stocked at 56 licensed dispensaries across California, with the deepest coverage in San Francisco, Los Angeles, Costa Mesa, Lynwood, and San Jose. Search by ZIP code or city below to find the closest one, or filter by product type if you are after a specific format.
Market Insights Snapshot
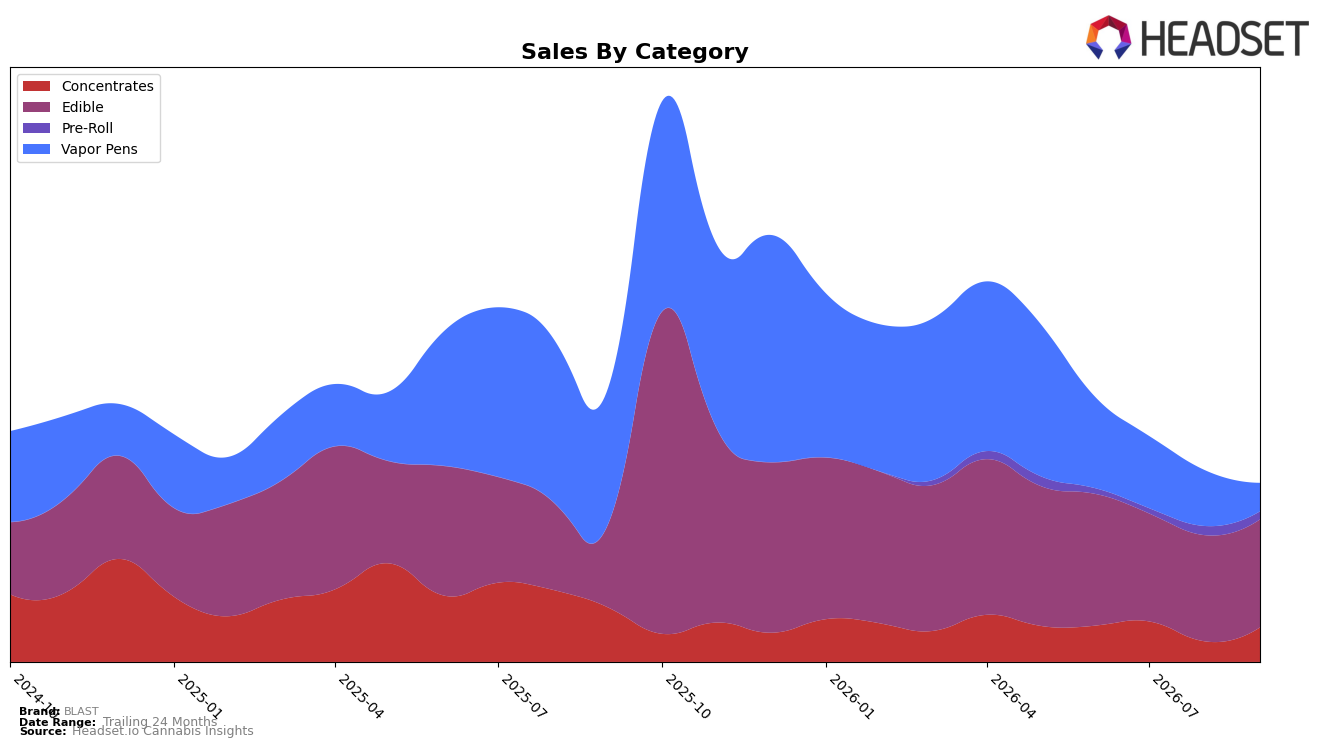
Edible now accounts for 60.54% share with 29.40% year-over-year growth and a 1.74% month-over-month lift, while Vapor Pens fell to 15.85% share with a -79.24% YoY decline and a -49.33% MoM drop; Concentrates sits at 19.24% share with -36.72% YoY but a 68.44% MoM surge. Pre-Roll remains small at 4.37% share with a -12.24% MoM change and no YoY read, and brand-wide average price is down 33.20% YoY to $6.54. This mix indicates a pivot toward lower-priced Edible volume offsetting Vapor Pens contraction, with a short-term Concentrates rebound counterbalancing category risk.
With Edible ranked 11 in British Columbia and holding 60.54% of BLAST sales, the 29.40% YoY gain alongside a 1.74% MoM rise suggests the brand’s defensible lane is value-led Edibles, while the -79.24% YoY and -49.33% MoM in Vapor Pens signal retreat from inhalable share. The 68.44% MoM jump in Concentrates versus a -36.72% YoY trough implies tactical restocking or promotional elasticity, pointing to a positioning that prioritizes Edible-led traffic with opportunistic Concentrates spikes rather than sustained inhalable leadership.
Competitive Landscape
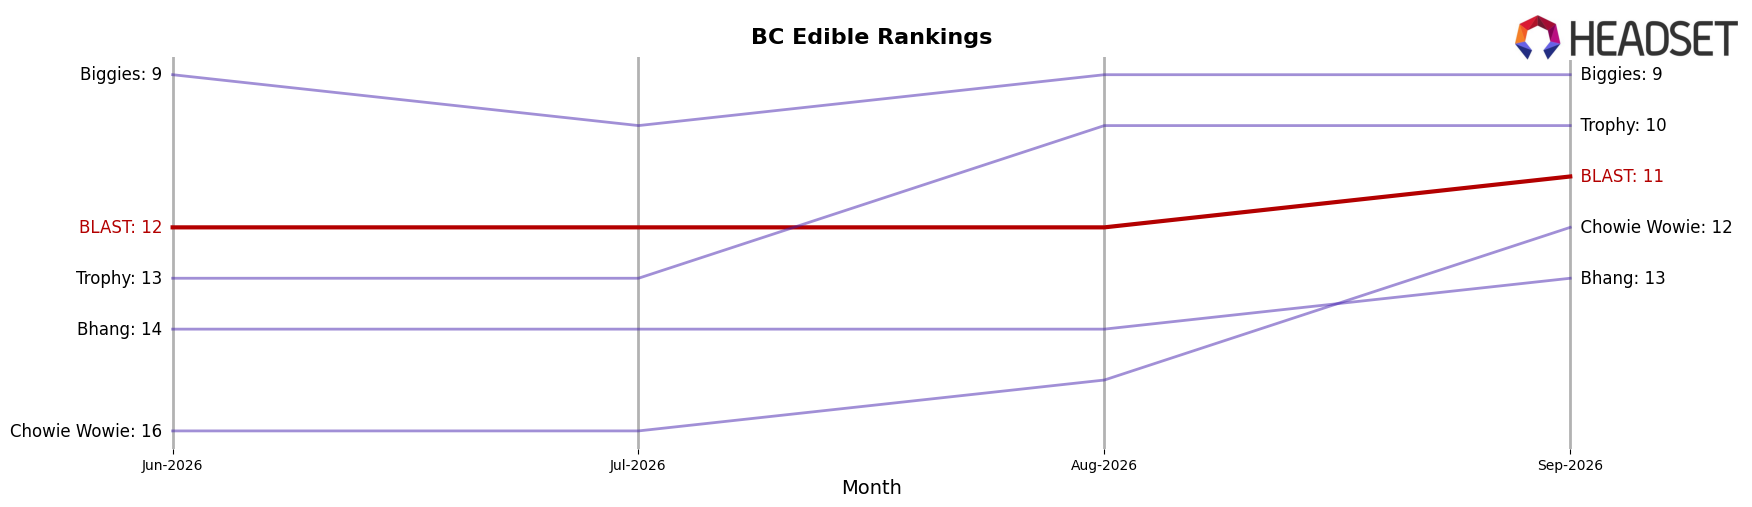
BLAST sits at rank #11 in BC Edible for September 2026, improving 3 positions from #14 year over year, yet slipping 1 spot from #12 in June 2026; this contrasts with Spinach moving up from #2 to #1 and Gron / Grön moving down from #1 to #2 while posting a -2.32% year-over-year sales change versus Spinach at +31.60%. Against mid-pack movers, Wyld climbed from #5 to #4 with +120.30% year-over-year sales and 1964 Supply Co advanced from #6 to #5 with +89.63%, while BLAST’s prior peak of #3 in October 2025 and the 3-month drift from #12 to #11 indicate recovery is incremental rather than breakout at current velocity, implying the brand is stabilizing in the low-teens unless share capture accelerates against faster-rising rivals.
Notable Products
Black Hole Supreme Cured Resin (1g) delivered the standout movement in September 2026 with a 74.6% month-over-month surge and a rank of 5, while Cosmic Cotton Candy Live Resin Cartridge (1g) slid 42.9% MoM to rank 6, indicating a sharp channel shift away from Vapor Pens toward Concentrates. At the top of the leaderboard, CBN/THC 1:1 Lunar Eclipse Lemon Chamomile Live Rosin Gummy (10mg CBN, 10mg THC) rose 12.8% MoM to rank 1 as Animal Style Sour Wild Raspberry Live Rosin Gummy (10mg) fell 10.5% MoM at rank 4, and four of the top ten are Edible SKUs, concentrating demand in functional gummy formats. Higher Chewz - CBG/THC 5:1 Ruby Grapefruit Gummies 5-Pack (50mg CBG, 10mg THC) jumped 51.6% MoM at rank 8 while LA Kush Cake Sour Pineapple Live Rosin Gummy (10mg) declined 5.7% MoM at rank 3, suggesting premium minor-cannabinoid propositions are gaining traction even as some legacy flavors soften. Taken together, the mix points to BLAST leaning into minor-cannabinoid Edibles while expanding margin-rich Concentrates, with Vapor Pens ceding wallet share despite a $13,350 month for the leading cartridge.
Top Selling Cannabis Brands






Data for this report comes from real-time sales reporting by participating cannabis retailers via their point-of-sale systems, which are linked up with Headset’s business intelligence software. Headset’s data is very reliable, as it comes digitally direct from our partner retailers. However, the potential does exist for misreporting in the instance of duplicates, incorrectly classified products, inaccurate entry of products into point-of-sale systems, or even simple human error at the point of purchase. Thus, there is a slight margin of error to consider. Brands listed on this page are ranked in the top twenty within the market and product category by total retail sales volume.

