.svg)

Sep-2026
Sales
Trend
6-Month
Product Count
SKUs
Avg Price
YoY Sales Change
YoY Price Change


Where to Buy
BLVCK MRKT / BL^CK MRKT is stocked at 28 licensed dispensaries across Maryland, with the deepest coverage in Baltimore, Columbia, Middle River, Rockville, and Upper Marlboro. Search by ZIP code or city below to find the closest one, or filter by product type if you are after a specific format.
Market Insights Snapshot
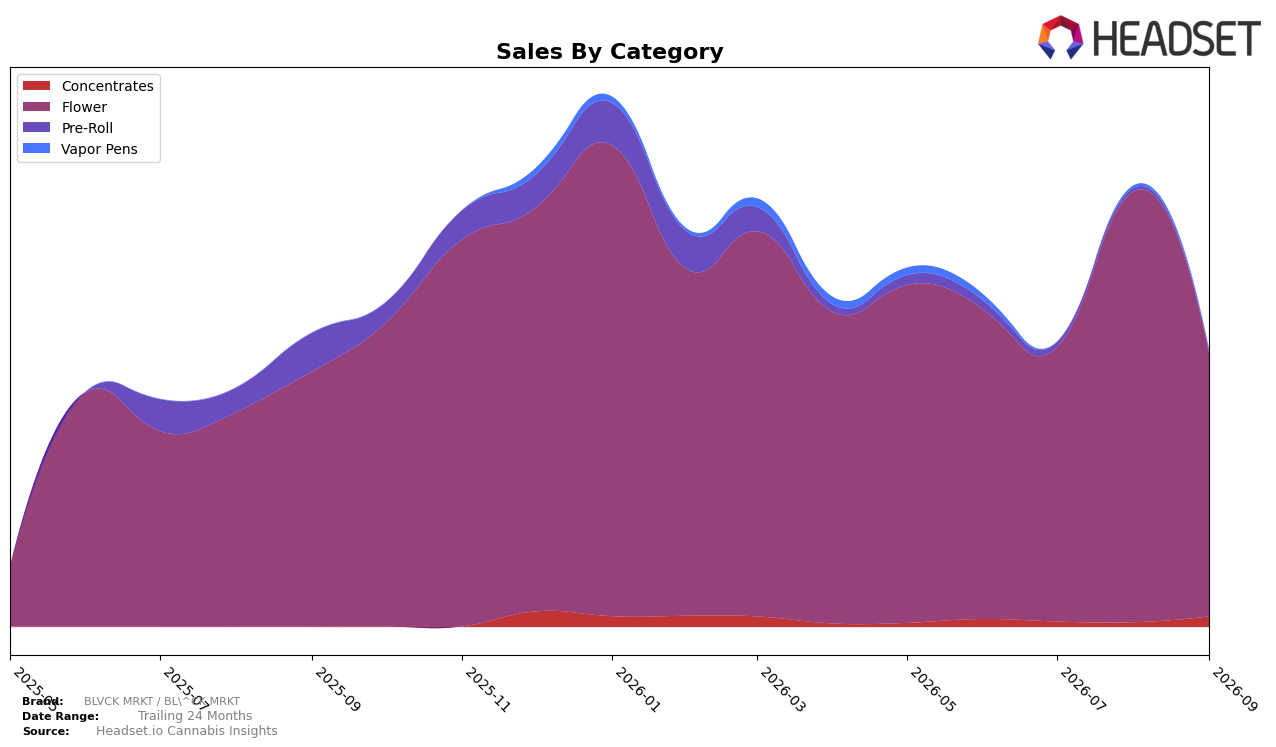
BLVCK MRKT / BL^CK MRKT concentrated 95.10% of September 2026 sales in Flower, which rose 2.55% year over year but fell 39.20% month over month, while Concentrates expanded to 3.77% share with a 132.16% month-over-month increase and Pre-Roll contracted to 0.78% share with a 94.39% year-over-year decline. Vapor Pens slipped to 0.36% share with a 54.79% month-over-month drop, and the brand’s average price decreased 6.75% year over year to $27.49 even as brand sales declined 6.22% year over year, implying volume gains in Flower offset some revenue pressure but the sharp month-over-month pullback concentrated that pressure in September 2026.
In Maryland Flower, the brand sat at rank 29 in September 2026, and with 95.10% of mix tied to Flower alongside a 39.20% month-over-month decline, current positioning is highly sensitive to single-category volatility. The simultaneous 132.16% month-over-month rise in Concentrates from a 3.77% base and a 33.51% month-over-month decline in Pre-Roll suggest a pivot opportunity toward higher-priced subsegments (Concentrates at a $31.77 average price versus Flower at $27.53) to reduce rank and revenue exposure to Flower swings, while the 6.75% year-over-year average price decrease paired with a 6.22% year-over-year sales decline points to mix-led or promotional levers as the practical path to stabilize share and improve positioning within the rank 29 corridor.
Competitive Landscape
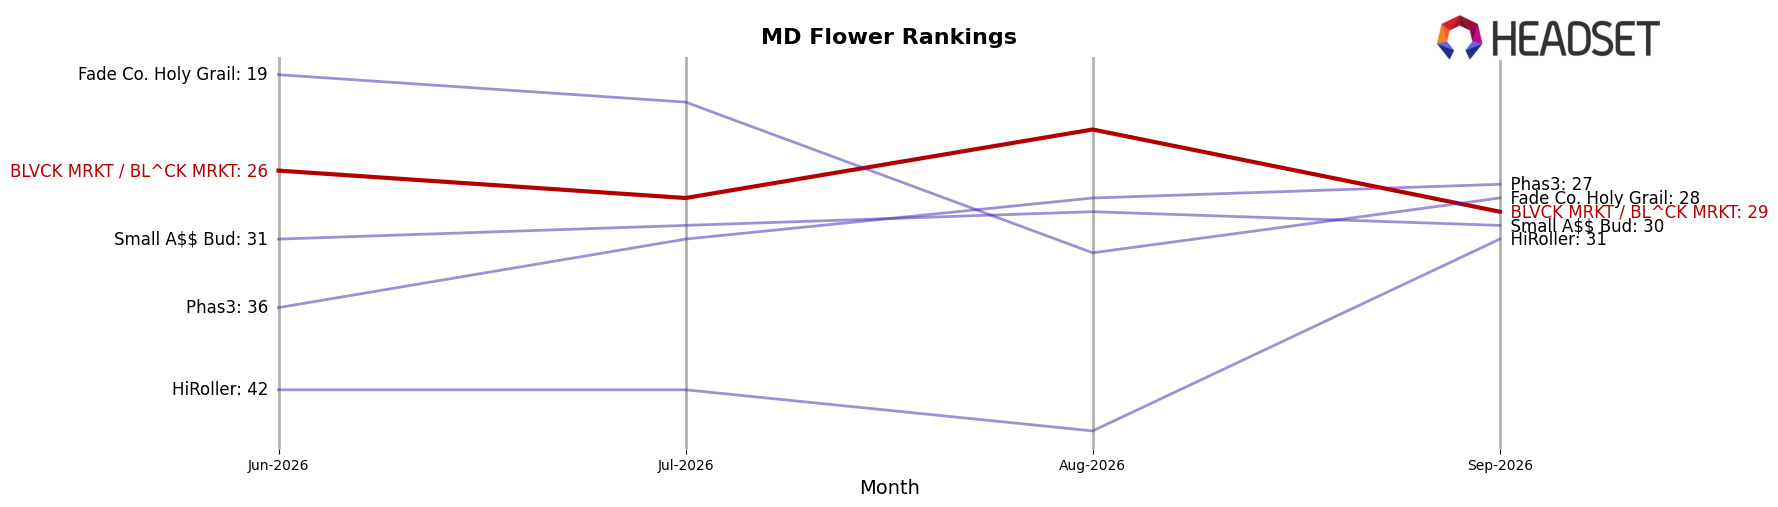
BLVCK MRKT / BL^CK MRKT sits at rank #29 in Maryland Flower for September 2026, down 1 position year over year from #28 and slipping 3 spots since June 2026 from #26, after peaking at #21 in January 2026; this downward drift contrasts with Fade Co. climbing year over year from #3 to #2 with 8.9% sales growth while District Cannabis fell from #2 to #4 with a 29.4% sales decline, indicating BLVCK MRKT / BL^CK MRKT is losing relative momentum despite mixed moves among leaders and will need a reversal to avoid further share erosion implied by the rank softening.
Notable Products
Tear Gas (3.5g) posted the steepest decline in September 2026 at -62.4% MoM, while category leader G-Funk (3.5g) fell -35.8% at rank 1 and Super Lemon Haze (3.5g) slid -41.6% at rank 3, indicating pressure concentrated among core SKUs. Han Solo Burger (3.5g) dropped -58.0% at rank 4 and Han Solo (3.5g) fell -48.4% at rank 5, and with all ten top SKUs in Flower, the mix is highly concentrated in a single category with little diversification. Oreo Blizzard (3.5g) declined -12.3% at rank 2, and the new-format Han Solo Burger (14g) entered at rank 10 with $25,459, suggesting volume is migrating to larger pack sizes even as 3.5g variants contract. The pattern implies BLVCK MRKT / BL^CK MRKT is pivoting toward value-driven Flower formats as eighth-ounce SKUs compress, risking overreliance on one category unless multi-format or cross-category options expand.
Top Selling Cannabis Brands






Data for this report comes from real-time sales reporting by participating cannabis retailers via their point-of-sale systems, which are linked up with Headset’s business intelligence software. Headset’s data is very reliable, as it comes digitally direct from our partner retailers. However, the potential does exist for misreporting in the instance of duplicates, incorrectly classified products, inaccurate entry of products into point-of-sale systems, or even simple human error at the point of purchase. Thus, there is a slight margin of error to consider. Brands listed on this page are ranked in the top twenty within the market and product category by total retail sales volume.

