.svg)


Where to Buy
Blue Planet Chocolate is stocked at 33 licensed dispensaries across Ohio, with the deepest coverage in Cincinnati, Columbus, Ashtabula, Oxford, and Warren. Search by ZIP code or city below to find the closest one.
Market Insights Snapshot
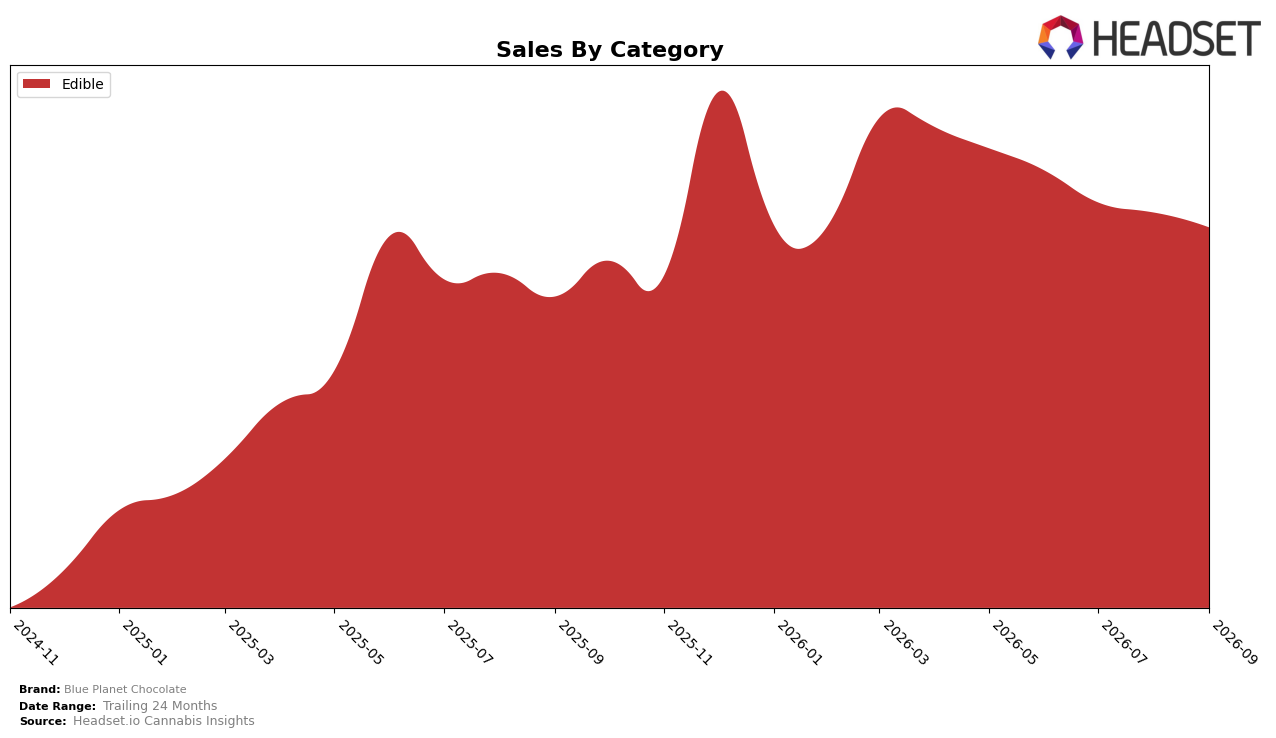
Edible accounts for 100.0% of Blue Planet Chocolate’s mix in September 2026, with year-over-year sales up 20.96% and month-over-month sales down 3.61%. Average price declined 16.35% YoY to $24.49, while the brand ranked 20 in Edible in Ohio. The combination of double-digit YoY growth alongside a single-category concentration and a lower price point implies the brand expanded volume within Edible but absorbed price compression that likely tempered recent monthly momentum.
Holding 100.0% exposure to Edible and sitting at rank 20 in Ohio suggests Blue Planet Chocolate is competing on price-driven accessibility rather than assortment breadth, as evidenced by a 16.35% YoY price decline paired with 20.96% YoY sales growth. The 3.61% MoM decline within a fully concentrated mix indicates sensitivity to short-term category demand and pricing shifts, implying the brand’s positioning hinges on maintaining value perception to convert traffic into rank gains rather than diversifying into adjacent categories.
Competitive Landscape
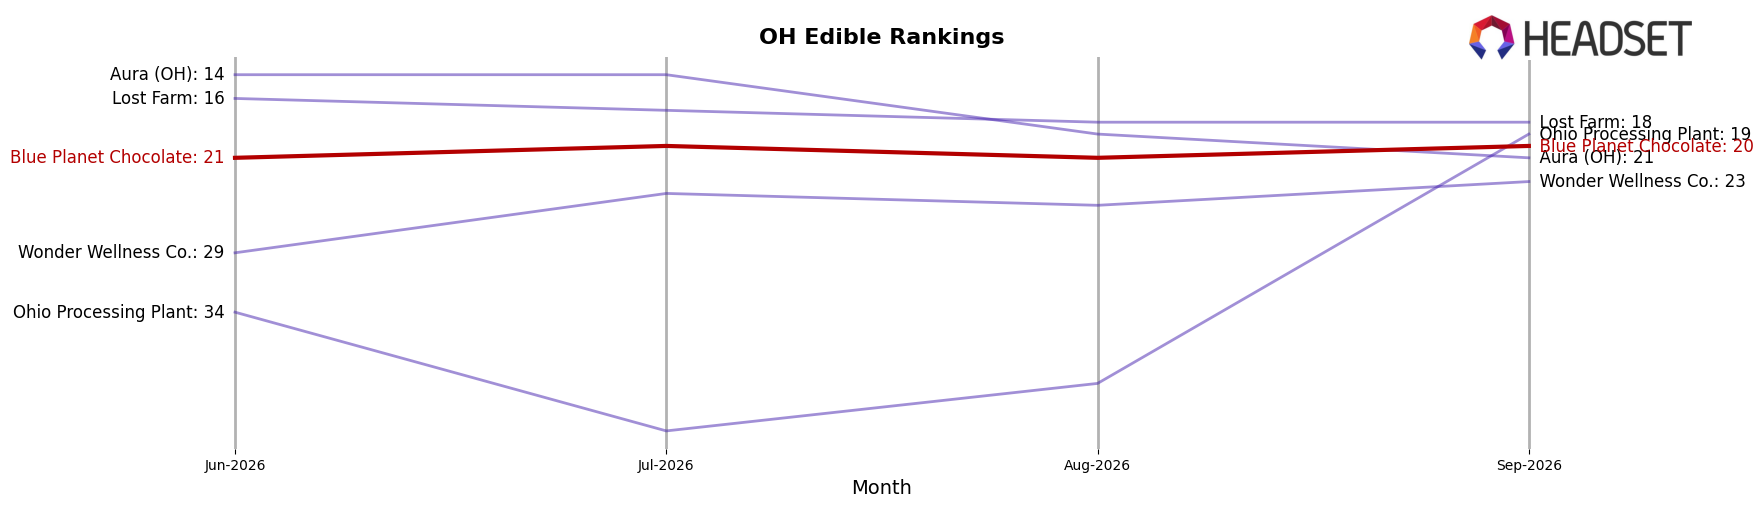
Blue Planet Chocolate sits at rank #20 in OH Edible in September 2026, a 7-position improvement from #27 in September 2025, and it inched up 1 spot from #21 in June 2026; this places its current peak at #20 in September 2026 while still 17 positions behind the category leader. Competitively, UB GOOD moved from #2 to #1 with a 46.1% YoY sales increase, while Incredibles slipped from #1 to #2 despite 35.4% YoY growth, indicating that Blue Planet Chocolate’s 7-rank YoY climb is happening amid faster ascents at the very top; the pattern implies Blue Planet Chocolate is progressing but needs accelerated share capture to convert a marginal 1-rank quarter-over-quarter rise into durable top-15 momentum.
Notable Products
Peanut Butter Creams Milk Chocolate Bites 4-Pack (100mg) posted the largest move in September 2026 with a 97% month-over-month gain to rank 1, while Dark Chocolate Bar 10-Pack (100mg) also cleared the +50% threshold at +55% to rank 3. In contrast, Milk Chocolate Bar 20-Pack (100mg) fell 24% to rank 5 and Milk Chocolate Malt Balls 10-Pack (100mg) dropped 41% to rank 10, indicating sharp divergence within the chocolate set. With nine of the top ten SKUs in Edible chocolate formats and only one non-chocolate gummy entrant at rank 8, the portfolio remains concentrated around chocolate even as bite-size formats surge and some large-format bars retrench; this tilt implies a shift toward higher-velocity, smaller units over bulk bars.
Top Selling Cannabis Brands






Data for this report comes from real-time sales reporting by participating cannabis retailers via their point-of-sale systems, which are linked up with Headset’s business intelligence software. Headset’s data is very reliable, as it comes digitally direct from our partner retailers. However, the potential does exist for misreporting in the instance of duplicates, incorrectly classified products, inaccurate entry of products into point-of-sale systems, or even simple human error at the point of purchase. Thus, there is a slight margin of error to consider. Brands listed on this page are ranked in the top twenty within the market and product category by total retail sales volume.

