Jun-2026
Sales
Trend
6-Month
Product Count
SKUs
Avg Price
YoY Sales Change
YoY Price Change
Market Insights Snapshot
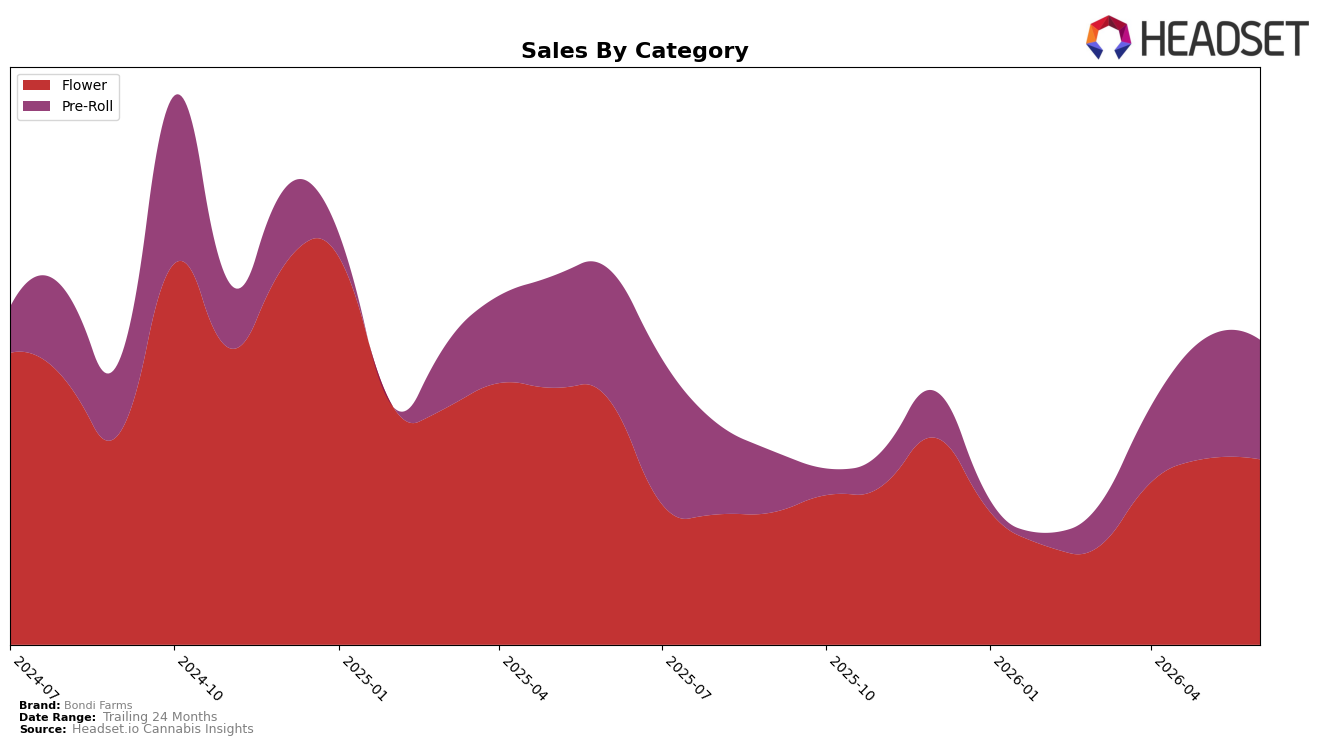
In June 2026, Bondi Farms split revenue almost evenly between Flower at 53.46% share and Pre-Roll at 46.54% share, yet both categories contracted, with Flower down 10.65% YoY and 0.11% MoM while Pre-Roll declined 2.32% YoY and 0.14% MoM. Against a brand-level sales change of -6.96% YoY and a -5.24% YoY shift in average price, the mix skews toward a higher-ticket Flower average price of $23.83 versus $6.19 for Pre-Roll, but Flower’s steeper YoY drop versus Pre-Roll’s milder decline implies category reliance that is pulling overall performance below where a Pre-Roll-weighted mix would land.
The combination of a 39th rank in Flower within Washington and a sharper YoY contraction in Flower than in Pre-Roll suggests Bondi Farms’ positioning leans on a category where it is mid-pack rather than buffered by the relatively more stable Pre-Roll trend. With Flower only marginally down MoM at -0.11% versus Pre-Roll’s -0.14% while prices fell YoY, the near-term pressure points are pricing and Flower competitiveness; the pattern implies that tilting mix and pricing architecture toward steadier Pre-Roll demand or improving rank within Flower would be the more direct route to stabilizing share.
Competitive Landscape
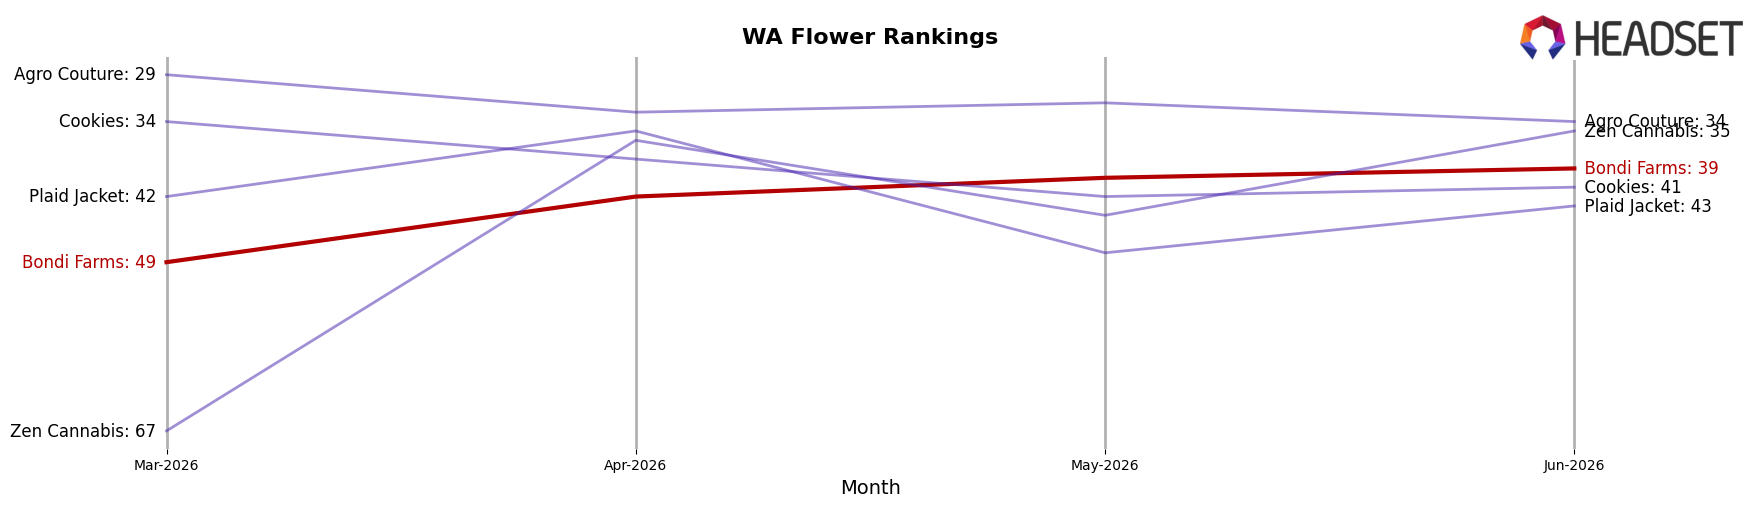
Bondi Farms sits at rank #39 in Washington Flower in June 2026, down 6 positions year over year from #33, but up 10 spots versus March 2026 when it was #49; this follows a longer arc from a peak of #27 in January 2025 to today’s lower tier, indicating slippage in competitive relevance. Against the top of the board, Phat Panda held #1 with a 16.6% year-over-year sales increase while Legends stayed at #2 despite a 19.8% decline, and the rising middle is tightening: Lifted Cannabis Co climbed from #8 to #3 with 17.9% growth and Fifty Fold moved from #9 to #4 on 22.3% growth, with Sweetwater Farms surging from #17 to #5 on 65.8% growth; the directional gap implies Bondi Farms’ recent quarter-on-quarter rebound is cyclical relief rather than a restored trajectory, and the YoY rank erosion signals share is being ceded to faster-rising mid-pack challengers.
Notable Products
The steepest movement in June 2026 came from Super Boof Pre-Roll 2-Pack (1g), which fell 22.3% MoM to rank 8 while Candyland Pre-Roll 2-Pack (1g) declined 10.2% at rank 4, signaling demand is rotating away from certain flavored profiles. Countering that, Super Silver Lemon Haze Pre-Roll 2-Pack (1g) climbed 24.7% MoM at rank 3 and Vortex Pre-Roll (1g) rose 15.8% at rank 7, while category concentration remained extreme with ten of the top ten SKUs in Pre-Roll formats, indicating portfolio depth is narrow even as winners and laggards polarize. Obama Kush Pre-Roll 2-Pack (1g) held rank 1 with a 3.9% MoM uptick and Super Lemon Haze Preroll 2-Pack (1g) eased 5.1% at rank 2, and the top two accounted for roughly $26,277 in June 2026, implying leadership is stable but reliant on a small set of headliners. Overall, the mix points to a Pre-Roll-centric strategy where incremental gains at the top coexist with double-digit retrenchment in mid-tier SKUs, suggesting Bondi Farms is concentrating on fewer hero strains while pruning or repositioning underperformers.
Top Selling Cannabis Brands
Data for this report comes from real-time sales reporting by participating cannabis retailers via their point-of-sale systems, which are linked up with Headset’s business intelligence software. Headset’s data is very reliable, as it comes digitally direct from our partner retailers. However, the potential does exist for misreporting in the instance of duplicates, incorrectly classified products, inaccurate entry of products into point-of-sale systems, or even simple human error at the point of purchase. Thus, there is a slight margin of error to consider. Brands listed on this page are ranked in the top twenty within the market and product category by total retail sales volume.

