.svg)
Sep-2026
Sales
Trend
6-Month
Product Count
SKUs
Avg Price
YoY Sales Change
YoY Price Change


Where to Buy
Spectra is stocked at 30 licensed dispensaries across Colorado, PR, and Mississippi, 20 of them in Colorado, with the deepest coverage in Denver, Boulder, Colorado Springs, Aspen, and Avon. Search by ZIP code or city below to find the closest one, or filter by product type if you are after a specific format.
Market Insights Snapshot
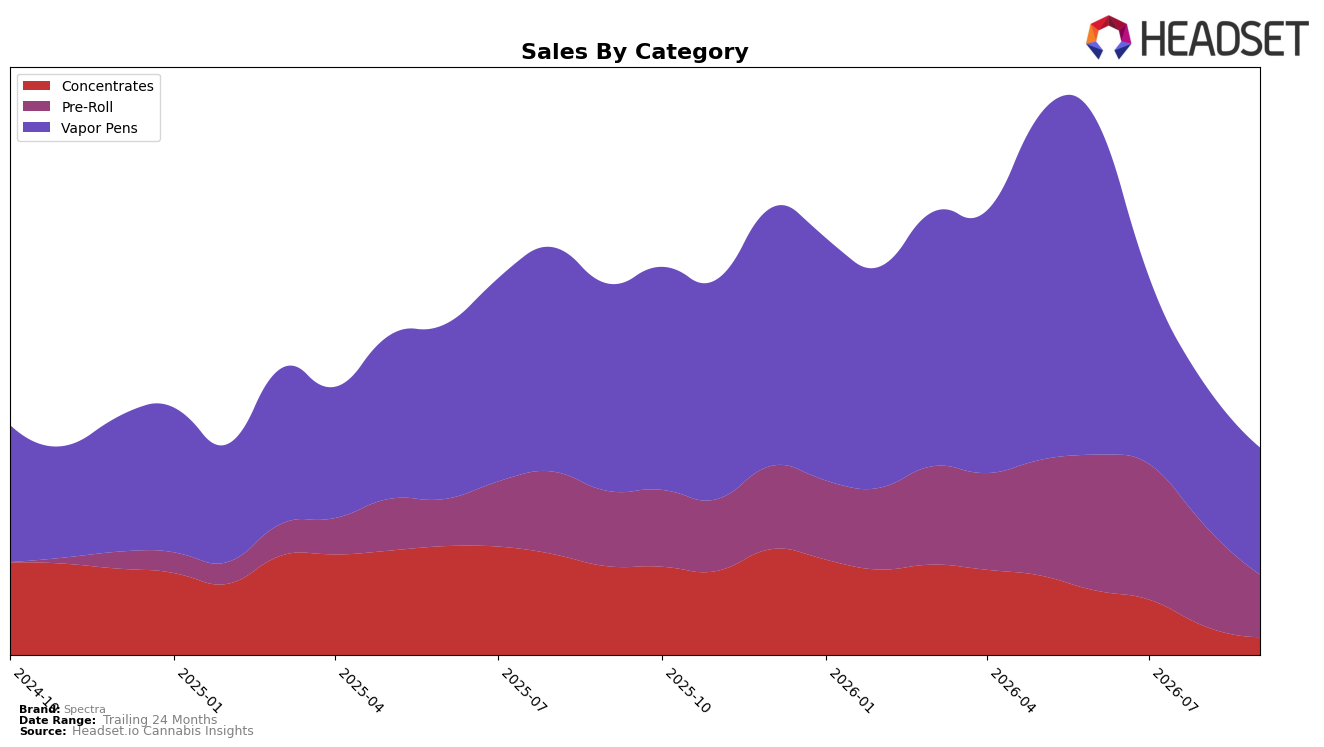
Spectra’s category mix in September 2026 concentrated 54.85% of sales in Vapor Pens, where year-over-year sales fell 35.27% and month-over-month declined 8.70%, while Pre-Roll held 30.80% share with a 13.35% YoY drop and a sharper 31.71% MoM pullback. Concentrates accounted for 14.35% share but contracted 64.75% YoY and 22.06% MoM, coinciding with an average price increase of 6.56% across the brand and a Vapor Pens ticket at $23.57. With Vapor Pens anchoring mix but compressing, and Pre-Roll’s MoM slide outpacing category peers, the pattern implies Spectra is over-indexed to segments under immediate pressure and is unlikely to offset a brand-level -37.89% YoY sales decline without reallocating toward more resilient formats.
Positionally, a 16 rank in Colorado Vapor Pens alongside a 54.85% mix share indicates mid-pack shelf presence in a primary category even as MoM erosion of 8.70% trails the 31.71% MoM contraction in Pre-Roll, suggesting the path to stability lies in defending Vapor Pens while selectively pruning Pre-Roll. The 14.35% Concentrates share paired with a 64.75% YoY drop and a 22.06% MoM decline points to diminishing ROI relative to the brand’s average price up 6.56%, implying Spectra’s pricing power is insufficient to counter volume losses and that tightening focus on Vapor Pens in Colorado could yield better rank efficiency than spreading effort across lagging categories.
Competitive Landscape
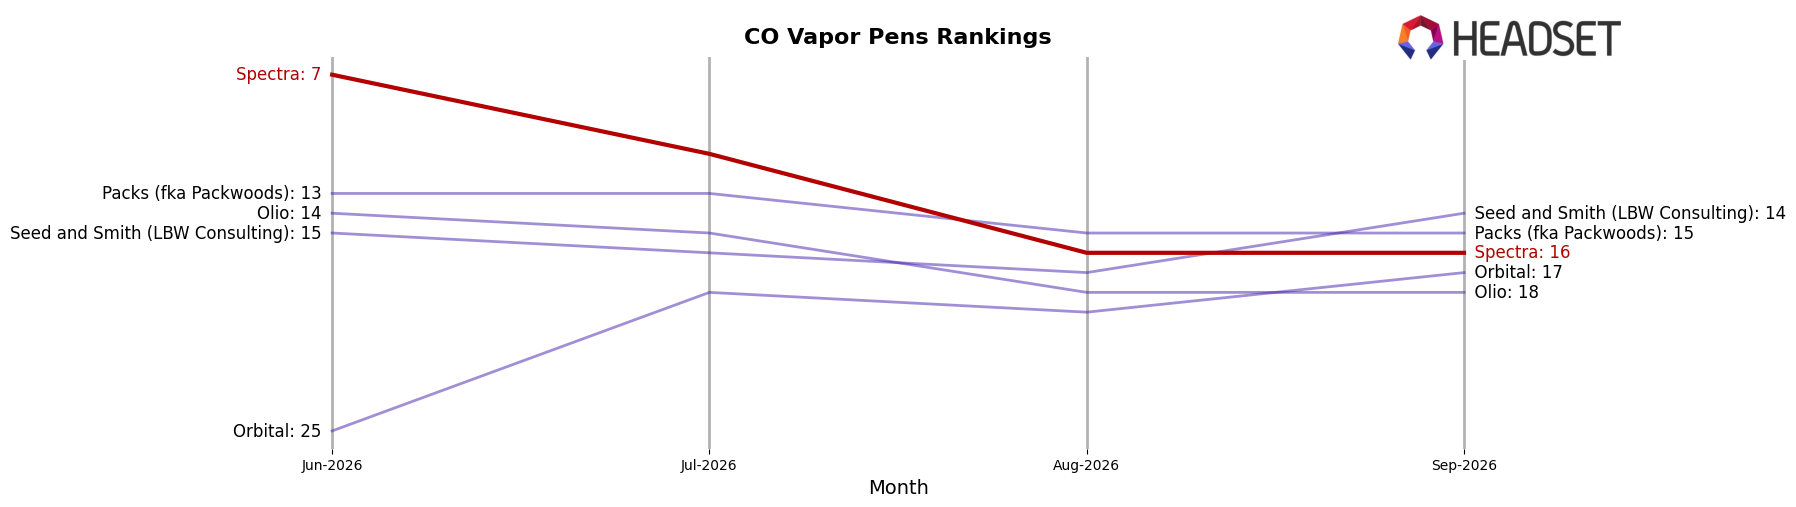
Spectra sits at rank #16 in CO Vapor Pens in September 2026, down 8 positions year over year and sliding 9 spots from #7 in June 2026 to #16 in September 2026, despite having peaked at #6 in May 2026; meanwhile, Spherex held #1 with a 1.93% YoY sales gain while PAX advanced from #3 to #2 on 34.66% YoY growth, and Jetty Extracts surged from #15 to #4 alongside 150.95% YoY growth, indicating that Spectra’s rank deterioration is less about category contraction and more about share being absorbed by faster-rising competitors.
Notable Products
September 2026 lacked any outsized swings, with the steepest move a modest -6.1% MoM for Strawberry Lemonade Infused Blunt (1.5g) at rank 5 while Glueball Infused Blunt (1.5g) rose 11.8% to rank 2. Pre-Rolls occupy six of the top ten ranks, including rank 1 and rank 4, yet Vapor Pens place three SKUs between ranks 3 and 8, indicating wallet share is balancing across form factors. The Plant Power 9 - Strawberry Lemonade Live Resin Cartridge (1g) sits at rank 7 despite generating $35,688, whereas the rank-3 Plant Power 6 - Tangerine Dream Distillate Cartridge (1g) has no reported MoM change, pointing to stability in distillate while live resin over-indexes on revenue per SKU. Net pattern: Spectra’s mix is tilting toward higher-value Vapor Pens while keeping Pre-Rolls as volume anchors, which implies near-term pricing power in cartridges coupled with rank defense in infused blunts.
Top Selling Cannabis Brands






Data for this report comes from real-time sales reporting by participating cannabis retailers via their point-of-sale systems, which are linked up with Headset’s business intelligence software. Headset’s data is very reliable, as it comes digitally direct from our partner retailers. However, the potential does exist for misreporting in the instance of duplicates, incorrectly classified products, inaccurate entry of products into point-of-sale systems, or even simple human error at the point of purchase. Thus, there is a slight margin of error to consider. Brands listed on this page are ranked in the top twenty within the market and product category by total retail sales volume.

