Jun-2026
Sales
Trend
6-Month
Product Count
SKUs
Avg Price
YoY Sales Change
YoY Price Change
Market Insights Snapshot
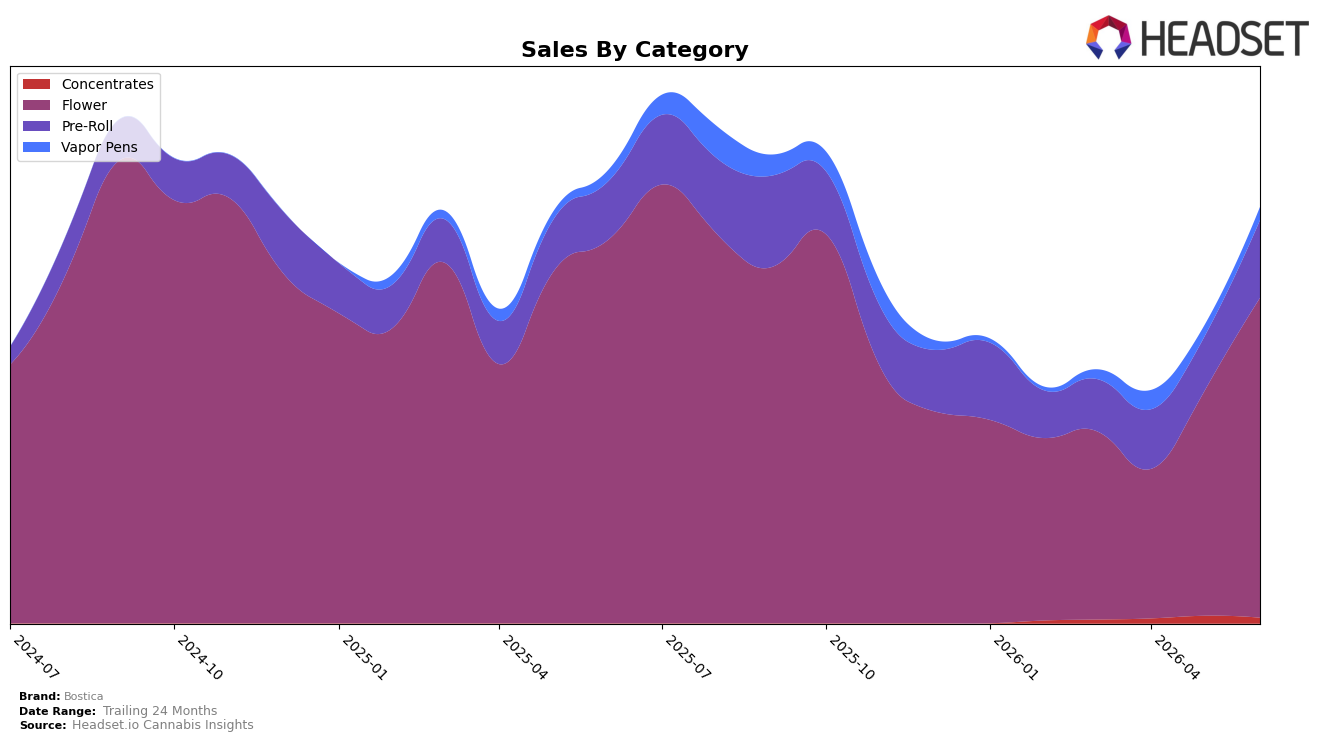
In June 2026, Bostica’s mix concentrated further into Flower at 76.96% share despite a -16.61% year-over-year decline and a 42.25% month-over-month rebound, while Pre-Roll rose to 18.61% share with 33.06% YoY growth and 42.91% MoM expansion. Vapor Pens held 3.08% share with 17.46% YoY and 16.45% MoM gains, whereas Concentrates slipped to 1.35% share on a -25.87% MoM drop and no reportable YoY trend. Average price fell -3.37% YoY to $18.95 even as Flower carried a higher category price of $20.20, implying mix and price-pressure effects working in opposite directions. The pattern implies Bostica is leaning into volume-led recovery in Flower and Pre-Roll to offset an -8.17% brand-level YoY sales decline while consolidating away from smaller niches.
Bostica’s 10th rank in Flower in Massachusetts, combined with a 42.25% MoM Flower surge and 42.91% MoM Pre-Roll lift, suggests near-term shelf velocity is concentrated in value-leaning formats as average price declines -3.37% YoY and Vapor Pens grows 17.46% YoY from a 3.08% share base. The -16.61% YoY contraction in Flower alongside a 33.06% YoY rise in Pre-Roll indicates substitution within inhalables rather than net category expansion, tilting positioning toward accessible Flower dominance with Pre-Roll as the growth wedge. The pattern implies Bostica’s competitive footing will be won by defending a top-10 Flower slot while harvesting incremental share from Pre-Roll, using price architecture to trade shoppers across the two rather than pushing into smaller, more volatile niches like Concentrates (-25.87% MoM).
Competitive Landscape
Bostica is ranked #10 in MA Flower in June 2026 after a YoY decline of 2 positions from #8, while improving 15 spots versus March 2026 when it sat at #25; this places current performance 2 ranks below the brand’s peak #8 in July 2025 and 8 ranks behind the category leader. In contrast, Farmer's Cut rose from #3 to #1 with a 32.4% YoY sales increase, and Root & Bloom climbed from #16 to #5 alongside 158.9% YoY sales growth, indicating that Bostica’s short-term rebound from #25 to #10 is occurring amid faster upward movement by rivals; the trajectory implies Bostica is stabilizing mid-tier but ceding relative momentum unless it converts the recent quarter-on-quarter rank recovery into sustained gains.

Notable Products
Gelato 33 (3.5g) posted the standout move in June 2026 with a 170.8% month-over-month surge and climbed into rank 4, while Purple Milk (3.5g) rose 105.1% to rank 3. Drip (3.5g) held rank 1 with a 44.2% gain and $155,832 in sales, while Mind Melt (3.5g) advanced 45.0% at rank 5. With eight of the top ten being Flower SKUs and only two Pre-Rolls in ranks 9 and 10, the mix implies Bostica is consolidating share around premium Flower velocity rather than breadth in format diversification.
Top Selling Cannabis Brands
Data for this report comes from real-time sales reporting by participating cannabis retailers via their point-of-sale systems, which are linked up with Headset’s business intelligence software. Headset’s data is very reliable, as it comes digitally direct from our partner retailers. However, the potential does exist for misreporting in the instance of duplicates, incorrectly classified products, inaccurate entry of products into point-of-sale systems, or even simple human error at the point of purchase. Thus, there is a slight margin of error to consider. Brands listed on this page are ranked in the top twenty within the market and product category by total retail sales volume.

