Jun-2026
Sales
Trend
6-Month
Product Count
SKUs
Avg Price
YoY Sales Change
YoY Price Change
Market Insights Snapshot
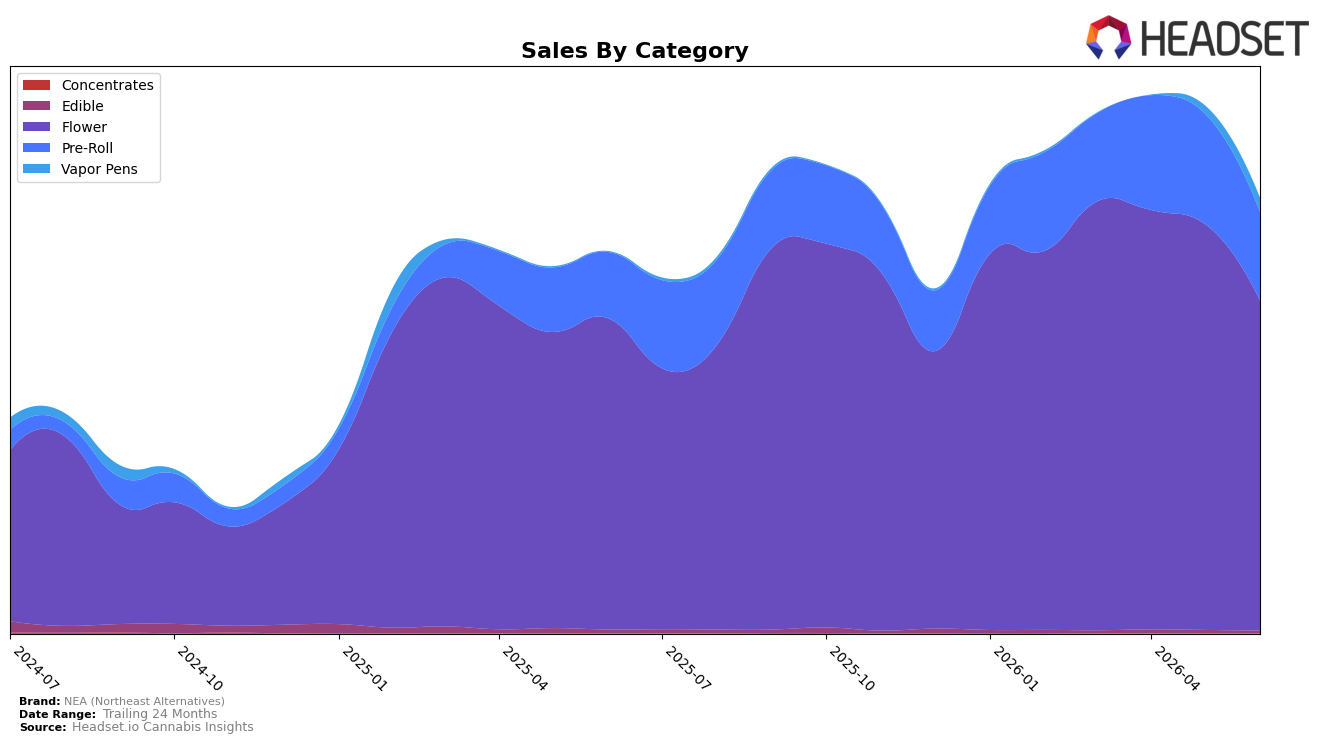
In June 2026, NEA (Northeast Alternatives) concentrated 75.93% of sales in Flower with a 6.09% year-over-year gain but a 18.75% month-over-month decline, while Pre-Roll held 20.33% share with 33.85% year-over-year growth and a 19.85% month-over-month drop. Vapor Pens expanded to 3.18% share on a 2,259.12% year-over-year surge and a 76.35% month-over-month increase, contrasting with Edible at 0.56% share posting a 28.65% year-over-year decrease and a 20.38% month-over-month decline. With average price down 18.09% year-over-year to $12.05 and Flower ranked 14th in Massachusetts within category, the mix suggests a pivot toward lower-priced, high-velocity formats and an emerging test of inhalables beyond Flower despite near-term monthly pullbacks in the two largest lines.
The combination of a 33.85% year-over-year gain in Pre-Roll alongside a 2,259.12% year-over-year jump in Vapor Pens and a 76.35% month-over-month lift indicates the brand is broadening its inhalables footprint while Flower absorbs a 18.75% month-over-month reset from a still-dominant base of 75.93% share. The 28.65% year-over-year decline in Edible and its 0.56% share, paired with a 19.85% month-over-month drop in Pre-Roll, implies demand is consolidating into cost-accessible combustion and rapidly scaling vape trial as average price fell 18.09% year-over-year; together with a 14.04% brand sales year-over-year increase, this positions NEA (Northeast Alternatives) to trade volume for reach and shelf breadth while using Flower’s Massachusetts rank of 14 to anchor visibility and funnel traffic into higher-growth inhalable segments.
Competitive Landscape
NEA (Northeast Alternatives) sits at rank #14 in MA Flower for June 2026, a 6-place improvement from #20 year over year, but down 1 position from a peak of #13 reached in May 2026; that mix of a +6 YoY climb and a -1 month-over-month slip suggests momentum that is not yet locked in. Meanwhile, Farmer's Cut advanced from #3 to #1 with 32.4% YoY sales growth, and Root & Bloom surged from #16 to #5 on 158.9% YoY growth, outpacing NEA (Northeast Alternatives) despite NEA’s YoY rank gain; by contrast, Simply Herb slipped from #1 to #2 alongside a -1.6% YoY sales change. The pattern—steady YoY rank recovery against faster-climbing rivals and a near-term dip from #13 to #14—implies NEA (Northeast Alternatives) must convert incremental rank gains into sustained top-10 positioning or risk being outrun by peers accelerating multiple ranks per quarter.

Notable Products
Zsweet Inzanity (3.5g) led the movement with a -63.7% month-over-month drop while holding rank 1, and Tropicana Cherry (3.5g) declined -15.3% at rank 3. Garlicane (3.5g) also contracted -55.8% at rank 6, creating a cluster of double-digit retreats at the top of the chart. With eight of the top ten anchored in Flower, the category concentration alongside simultaneous rank durability and percentage declines implies reliance on a few flagship Flower strains that are overexposed to volatility rather than diversified growth.
Top Selling Cannabis Brands
Data for this report comes from real-time sales reporting by participating cannabis retailers via their point-of-sale systems, which are linked up with Headset’s business intelligence software. Headset’s data is very reliable, as it comes digitally direct from our partner retailers. However, the potential does exist for misreporting in the instance of duplicates, incorrectly classified products, inaccurate entry of products into point-of-sale systems, or even simple human error at the point of purchase. Thus, there is a slight margin of error to consider. Brands listed on this page are ranked in the top twenty within the market and product category by total retail sales volume.

