Market Insights Snapshot
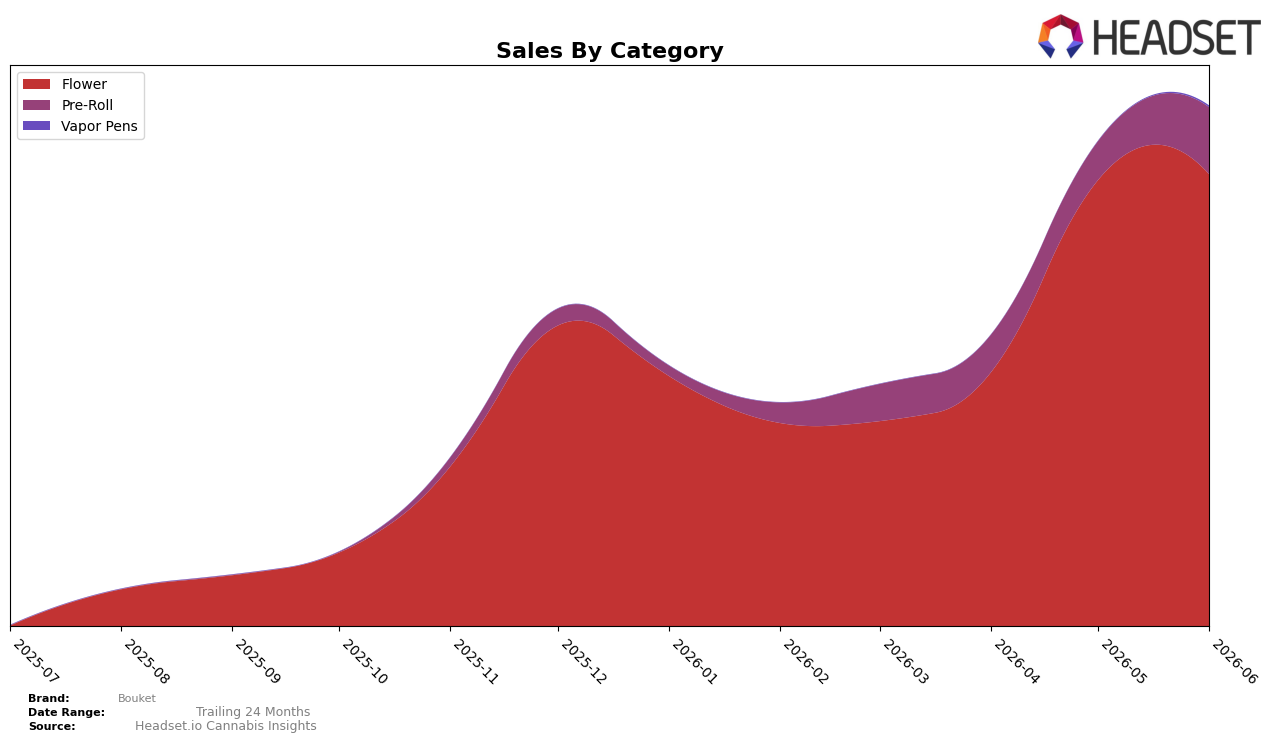
Bouket’s category mix in June 2026 is concentrated in Flower at 86.89% share with a month-over-month lift of 1.15%, while Pre-Roll holds 12.84% share on a 72.65% MoM surge and Vapor Pens sits at 0.26% share after a 1,193.50% MoM jump. Within New York Flower, the brand stands at rank 13, which pairs with a portfolio-average price of $32.67 against category-level averages of $44.71 in Flower and $11.54 in Pre-Roll to indicate a barbell in pricing exposure. The pattern implies Bouket is still anchored to Flower scale but is rapidly testing adjacency in Pre-Roll and Vapor Pens, and the mixed price architecture sets the stage for volume capture without immediate dilution risk.
The sharp 72.65% MoM acceleration in Pre-Roll alongside a 1,193.50% MoM rise in Vapor Pens, against a more modest 1.15% MoM lift in Flower and a rank of 13 in New York Flower, implies Bouket is using niche categories to supplement share where its core faces mid-pack positioning. With Pre-Roll at 12.84% share and Vapor Pens at 0.26% share, the current mix still leaves over 86.89% of sales dependent on Flower, so near-term growth will hinge on converting the high-velocity but low-base Vapor Pens and sustaining Pre-Roll momentum without eroding Flower rank. The pattern implies Bouket’s positioning is migrating toward a Flower-led brand with opportunistic halo categories that can lift total basket size and stabilize rank volatility as adjacent lines scale from small bases.
Competitive Landscape
Bouket is ranked #13 in NY Flower in June 2026, with no year-over-year rank available, and it climbed 12 positions versus March 2026 when it sat at #25; this #13 mark is also its peak to date in June 2026. In contrast, Find. holds #1 after moving up from #3 year over year with 35.6% sales growth, while RYTHM advanced to #5 from #10 alongside 40.6% sales growth; meanwhile, Dank. By Definition slipped to #3 from #1 with a 50.7% sales decline. The combination of Bouket’s 12-rank climb since March 2026 and reaching a first-time peak at #13 in June 2026 implies momentum into the lower-top tier but also a gap to the top five where faster risers are consolidating share.

Notable Products
Walkabout (3.5g) posted the steepest decline in June 2026, down 35.6% while slipping to rank 2, and Dark Matter OG (3.5g) fell 31.5% at rank 10, implying demand is rotating away from larger-flower purchases toward smaller formats. Blue Nerdz Pre-Roll (1g) held rank 1 with $21,199 as Walkabout Pre-Roll (1g) slid 27.9% at rank 6, and six of the top ten are Pre-Roll SKUs, indicating mix shift toward quick-consumption items despite volume softening in certain strains. The pattern suggests Bouket’s commercial direction is tilting toward pre-roll led velocity where strain loyalty is less durable than format preference.
Top Selling Cannabis Brands
Data for this report comes from real-time sales reporting by participating cannabis retailers via their point-of-sale systems, which are linked up with Headset’s business intelligence software. Headset’s data is very reliable, as it comes digitally direct from our partner retailers. However, the potential does exist for misreporting in the instance of duplicates, incorrectly classified products, inaccurate entry of products into point-of-sale systems, or even simple human error at the point of purchase. Thus, there is a slight margin of error to consider. Brands listed on this page are ranked in the top twenty within the market and product category by total retail sales volume.

