.svg)

Sep-2026
Sales
Trend
6-Month
Product Count
SKUs
Avg Price
YoY Sales Change
YoY Price Change


Where to Buy
BowHouse is stocked at 155 licensed dispensaries across Michigan, with the deepest coverage in New Buffalo, Detroit, Menominee, Coldwater, and Lansing. Search by ZIP code or city below to find the closest one, or filter by product type if you are after a specific format.
Market Insights Snapshot
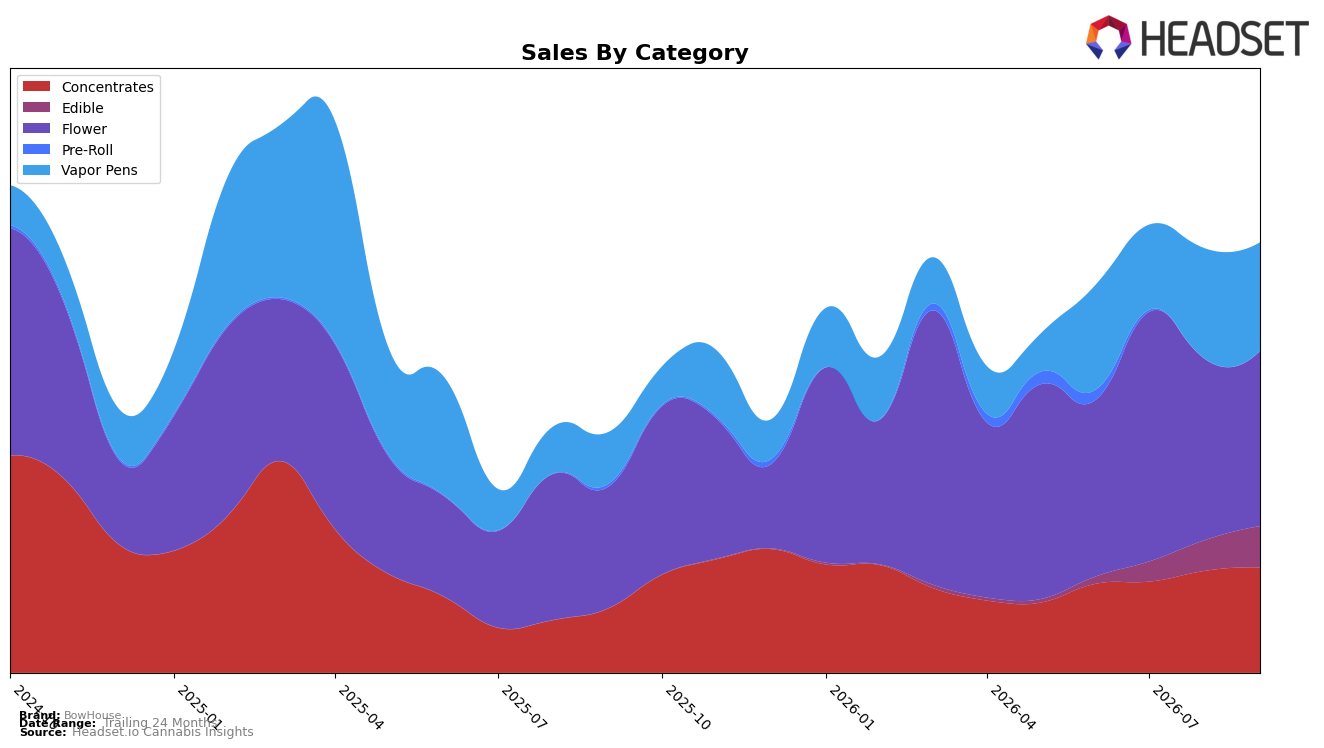
BowHouse’s mix in September 2026 is anchored by Flower at 40.75% share with a 44.31% year-over-year lift but a 3.42% month-over-month dip, while Vapor Pens hold 25.18% share with 109.64% year-over-year growth and a 1.84% month-over-month pullback; Concentrates sit at 24.48% share with 63.95% year-over-year growth and a 3.30% month-over-month uptick. Edible remains smaller at 9.59% share yet posts a 35.17% month-over-month gain with no reported year-over-year rate, and the average brand price fell 28.17% year over year to $13.17 even as total brand sales rose 79.20% year over year; this mix signals volume-led expansion concentrated in inhalables despite short-term softness in Flower and Vapor Pens.
Positioning-wise, BowHouse’s 89 rank in Flower in Michigan alongside a 3.42% month-over-month Flower decline and a 1.84% month-over-month Vapor Pens dip implies limited shelf pull in the largest lanes, while a 3.30% month-over-month gain in Concentrates and a 35.17% month-over-month jump in Edible indicate incremental traction in adjacent formats. With Vapor Pens up 109.64% year over year and Concentrates up 63.95% year over year under a 28.17% year-over-year price deflation, the pattern points to BowHouse competing on accessible price points to trade consumers into inhalables and then extending to Edible for basket add-ons, which positions the brand as a value-led inhalables core with opportunistic diversification rather than a Flower-led premium play.
Competitive Landscape
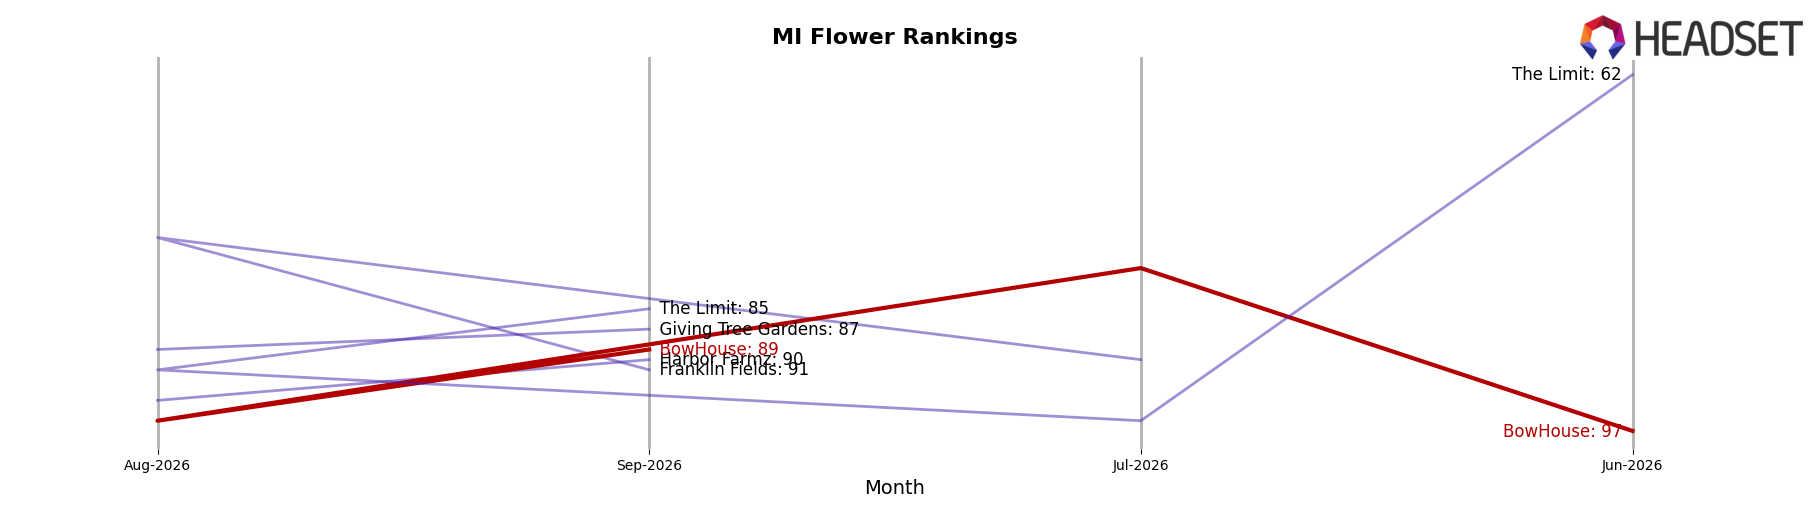
BowHouse sits at #89 in MI Flower in September 2026, up 54 positions YoY from #143, while improving 8 ranks from #97 in June 2026; despite a peak at #69 in March 2026 and a subsequent slide of 20 places since that peak, the current YoY climb outpaces many mid-tier moves. Against the leaders, High Minded held #1 YoY-to-current (1 to 1) even with a -3.3% YoY sales change, and Play Cannabis advanced from #7 to #2 alongside a 33.3% YoY sales increase; by contrast, BowHouse’s rank improved while not breaking into the top 50, indicating that gains are occurring in the lower tier rather than at the demand frontier. This trajectory—sharp YoY rank lift but retreat from the March 2026 peak—implies BowHouse is benefiting from broad market churn but lacks sustained momentum to consolidate position among the top quartile.
Notable Products
Blue Zkittles Distillate Cartridge (2g) posted the steepest movement in September 2026 with a -21.7% MoM drop while sliding to rank 10, contrasting with Blue Razz Bites Gummies 10-Pack (200mg) up 23.8% and Green Apple Gummy (200mg) up 33.7% at ranks 9 and 6. Watermelon Gummy (200mg) leads at rank 1 despite no MoM data provided, and Cotton Candy Z (Bulk) in Flower inched up 3.2% while holding rank 3. Five of the top ten are Edible SKUs clustered from ranks 1, 4, 6, 7, and 9, signaling a tilt toward gummies even as Vapor Pens weakens at the bottom of the leaderboard. The pattern implies BowHouse’s commercial direction is consolidating around Edibles-led velocity with selective Flower stability while Vapor Pens requires repositioning to prevent further share erosion.
Top Selling Cannabis Brands






Data for this report comes from real-time sales reporting by participating cannabis retailers via their point-of-sale systems, which are linked up with Headset’s business intelligence software. Headset’s data is very reliable, as it comes digitally direct from our partner retailers. However, the potential does exist for misreporting in the instance of duplicates, incorrectly classified products, inaccurate entry of products into point-of-sale systems, or even simple human error at the point of purchase. Thus, there is a slight margin of error to consider. Brands listed on this page are ranked in the top twenty within the market and product category by total retail sales volume.

